
Previous Story
GBP/USD analysis for September 18, 2017
Posted On 18 Sep 2017
Comment: 0
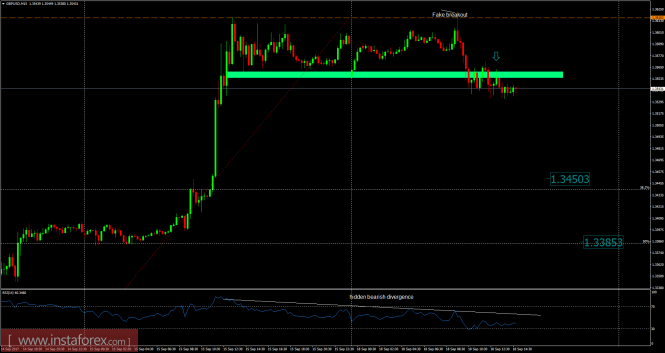
Recently, the GBP/USD pair has been trading upwards. The price tested the level of 1.3618. Anyway, according to the 15M time frame, I found a broken trading range and a fake breakout of Friday’s high at the price of 1.3616, which is a sign that buying looks risky. There is a hidden bearish divergence on the RSI oscilator, which is another sign of weakness. My advice is to watch for potential selling opportunities. The downward targets are set at the price of 1.3450 and 1.3385.
Resistance levels:
R1: 1.3612
R2: 1.3634
R3: 1.3650
Support levels:
S1: 1.3575
S2: 1.3560
S3: 1.3530
Trading recommendations for today: watch for potential selling opportunities.
The material has been provided by InstaForex Company – www.instaforex.com


