
Previous Story
Gold chart warns bulls for coming pull back
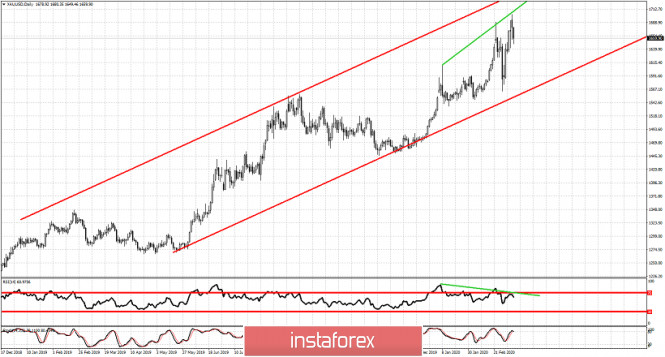
Gold price has reached our $1,700 target after pulling back towards $1,600-$1,580 as expected by our past analysis. However the new high in Gold was not followed by a higher high in the RSI and we have a second lower top in this oscillator. This is a bearish divergence with high significance.
Red lines – bullish channel
Green lines – bearish divergence
Gold price has made another higher high. Trend remains bullish as price is still inside the longer-term upward sloping channel. However the warning by the bearish divergence in the RSI makes me want to take profits and be at least neutral at current levels. Short-term support is found at $1.633 and a daily close below this level will increase the chances of a bigger reversal even towards $1,570-80 area again.
Red lines – bullish channel
Green lines -bearish divergence
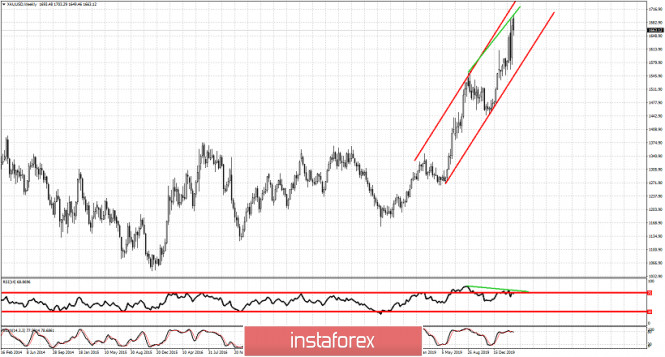
The bearish divergence is evident in the weekly chart as well. Gold price is most probably topping and a healthy pull back towards $1,500 is my main scenario. Gold has most probably completed the upward move that started around $1,170 and it is time to make a retracement of this move. We have only short-term reversal signals and no confirmation of this scenario yet. One thing is for sure, buying Gold at current levels is very risky.
The material has been provided by InstaForex Company – www.instaforex.com


