
Previous Story
Gold. Trading system “Regression Channels”. June 25, 2019
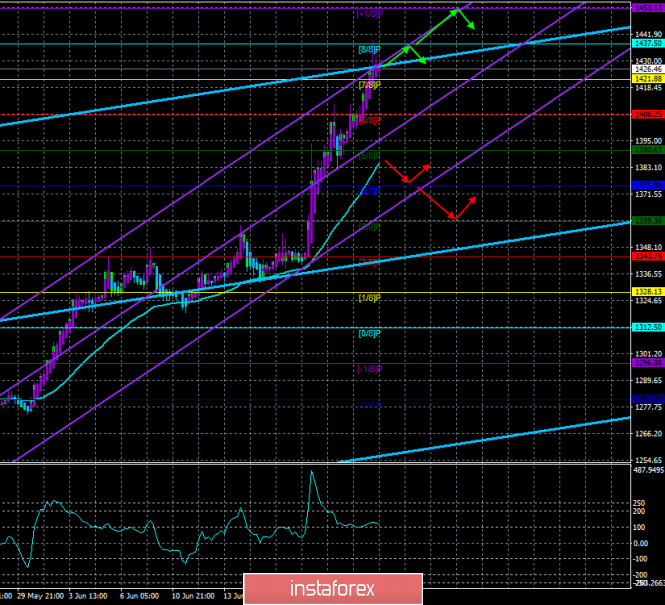
4-hour timeframe
Technical data:
The upper linear regression channel: direction – up.
The lower linear regression channel: direction – up.
The moving average (20; smoothed) – up.
CCI: 114.7640
Gold from May 30 rises in price continuously. For almost a month, the most famous drag metal managed to rise from $1,280 to $1,425. And the main culprit of this growth in gold prices is the US dollar, which in recent weeks has become cheaper on all fronts. Thus, it is not gold that is rising in price, and the US dollar is getting cheaper, which is reflected in the growth of gold prices. Accordingly, the further dynamics of the precious metal will be 90 percent dependent on the US dollar, US macroeconomic statistics and the Fed’s actions. If the Fed confirms (first) its intention to soften monetary policy, and then moves from words to action, it is likely to cause new sales of the US currency, the demand for it will drop, even more, the price will fall, and gold will rise. However, it is impossible to put all the blame only on the US dollar. After all, gold has repeatedly shown growth and in the absence of a fall in the dollar. We should not forget about the speculative factor, geopolitical risks and traders’ appetite for risky transactions and purchases of risky currencies. Now, gold continues to grow, as evidenced by all technical indicators, including Heiken Ashi (intraday) and ending with the moving average and two channels of linear regression. Thus, we recommend to continue buying gold as long as the upward trend remains.
Nearest support levels:
S1 – 1421.88
S2 – 1406.25
S3 – 1390.63
Nearest resistance levels:
R1 – 1437.50
R2 – 1453.13
R3 – 1468.75
Trading recommendations:
Gold continues to move up. Thus, it is recommended to trade for an increase with the goals of 1437.50 and 1453.13 before the reversal of the indicator Heiken Ashi down.
Orders for sale will become relevant not earlier than traders to overcome the Moving Aim with targets at 1375.00 and 1359.38.
In addition to the technical picture should also take into account the fundamental data and the time of their release.
Explanation of illustrations:
The upper linear regression channel – the blue line of the unidirectional movement.
The lower linear regression channel – the purple line of the unidirectional movement.
CCI – the blue line in the indicator window.
The moving average (20; smoothed) is the blue line on the price chart.
Murray levels – multi-colored horizontal stripes.
Heiken Ashi is an indicator that colors bars in blue or purple.
The material has been provided by InstaForex Company – www.instaforex.com
Source:: Gold. June 25th. Trading system “Regression Channels”. US dollar falls – gold becomes more expensive


