Previous Story
How To Choose The Right Indicators
Many traders, especially when starting out find themselves in a constant state of trading inertia. This is predominantly due to not knowing what to do next, or more specifically which technique or technical indicator to choose from and to apply as their preferred style or method of trading.
The results of a quick Google search on the internet will literally scare the pants off anyone starting out, as the sheer number of different indicators and strategies to use under different market conditions are mind boggling.
In another post of mine, I addressed the fundamental issues behind which technical indicators to use, and in this post, I wish to get down to the nuts and bolts of how to make the choice, .. in other words, how to short list the right indicators that fits your unique style of trading.
Indicators vs Chart Patterns
There exists an age old debate as to whether using actual chart patterns are more beneficial to using indicators.
The debate tries to establish if observing a particular chart formation, established as a result of certain price movements, is a better tool to use than looking at other indicators in trying to identify a possible trade set up.
Indicators in this sense could be trying to determine the current market’s conditions or state relative to that of a prior period, and from this trying to determine the possibility of a trade.
Let me clarify..
When prices are graphed day after day, traders tend to look at these charts trying to identify possible patterns or trading signals which they will use to somewhat and to a certain extent, try to pre-empt what they think will be the most likely next move the market will make.
For many traders, trying to get into a position before a big move is what they determine to be their “edge”. For other traders though, the allure of being the first one to spot a new trend is far less attractive than just catching the ride overall, or to trade with a given comfort level that at least they are trading in the same direction as the overall trend.
Clearly, the above indicates that traders can look at the very same chart pattern yet react differently.
This in its most fundamental form explains why certain types of traders prefer certain types of patterns over indicators or vice versa.
Truth is that there really is no golden rule here,…. no magic ticket that shows you the clear winner.
Your choice should match your trading style and personality
In real life you’ll find that in the end, the bulk of trading styles uses the same generic principals, however the most likely change or tweak would be the time frame over which they measure these movements.
Scalpers for example will typically look for price action to reveal patterns or breakouts over a short time frame or period, by using “1-minute” charts, where swing traders will in all likelihood use “daily” charts.
What this simply means is a scalper needs to see every single minute’s price action. Did this minute’s price move up or down, relative to the minute before that or not?
The reality is that the charts does not necessarily look any different
The fact remains that your trading style ultimately dictates the time frame over which you will observe the market. Some strategies do not require you to be glued to the screens the entire day, so daily charts will do for those, and even more specifically, some may even require end-of-day charts only and don’t even require you to be updated with live price movements as the market moves.
Anticipating the market or Following it?
The next step is to establish if your trading style requires you to pre-empt the market or not.
By pre-empting I mean that you are trying to be the first on to move, and then hopefully the market catches up.
An example of this would be via the use of Chart Patterns.
Chart patterns are interpreted from visual observations by the one analyzing the charts. The general idea being that if a ton of traders are observing the exact same action unfolding, one may be able to “predict” the upcoming trade direction to some extent.
The problem with this statement relies on other observers to view and interpret the same exact same outcome. You will see later on that this perception can wreak havoc depending on the difference in observation points used.
Furthermore, and possibly more for a different post, but analyzing a security with little other followers (i.e. low liquidity) can also produce false or unreliable signals.

The aim of using chart patterns are that by observing the price action one aims to establish what the charts are telling you depending on the “picture” it is busy painting in the charts.
Using triangles or wedges as an example is an indication of prices being squeezed in one way or another and that a possible break-out is expected to occur. Such a break-out usually is expected to have some significant momentum behind it as the market gets rid of all that pressure of being squeezed into one place.

Reminder – don’t ever lose sight of the fact that market prices are ultimately just a reflection of whether there are more buyers than sellers at a particular time or vice versa. So in an upward shaping wedge for example, the sellers are trying their best to push the market lower, yet the bulls (buyers) are constantly there to stop the size of their downwards efforts. This tug-of-war continues to exist until the sellers finally give up and the price roars higher as the bulls celebrate their price victory.
Keeping this simple image in mind, its easy to see why scalpers would keep a keen eye on these type of patterns, ever so ready to pull the trigger at the breakout of a wedge to catch the momentary spike as pressure is released.
But would a trend trader react in the same way?
Not necessarily……
A trader looking to catch a big overall momentum move and ride the wave, is far less likely to try and pin point the exact minute the market turned. In fact, most of the strategies used in these cases would rely on indicators rather than patterns.

A trend trader is far more interested in the strength of a trend than whether they caught the bottom or the top.
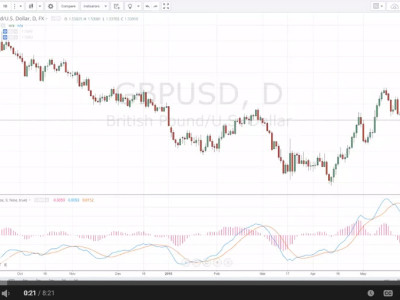
The graph below shows how “late” a trend trader can be to the party, not catching an exact bottom nor top.
One can easily argue that there clearly would have been a better price to enter (and exit) had the trend trader been watching the market more closely. However, by giving the market time to unfold and for the trend to properly take shape though late to the party, the trend trader still stand to make a nice profit from following the change in the trend once indentified and confirmed.

Avoid complex interpretation
Though the main aim of this post was to conclude the basic steps to follow in order to assist you in your decision-making process to determine which optimal patterns or indicators to use, I also wanted to include the ones I will be using most. It does not for one second imply these are the golden rules to follow, all I am to do is to remove some of the noise and point you to ones I have used a thousand times over, and the ones I know works perfectly well for what I intend to teach you here.
I am a firm believer in the fact that the most appropriate strategies to use (especially when starting out) are those where not a lot of individual interpretation is required.
Using chart patterns requires quite a bit of interpretation and drawing a support line at the wrong place, could imply completely different entry or exit prices than those of someone else observing the exact same price action unfolding.

Choosing the incorrect point to start from, or to connect to, can cause materially different observations and trade decisions.
Why risk it?
There are numerous indicators as an example which leaves far less room for interpretation. Yes, I know this is an understatement of the decision-making process but in general, and as an example, once a 50-day moving average crosses upwards over a downward sloping 200-day moving average, on the whole, chances are that a change in the trend is on the cards.
Similarly, a break of a 55-day high is a clear signal of a possible movement higher without having to interpret the exact point at which to enter, one can now rather spend time looking for a confirmation of this break.

You will no doubt agree that not a lot of interpretation is required to get us to this basic point of departure.
From here of course one can now compound other signals/indicators to measure the relative strength of the trend, the condition of the market (being over sold or over bought), all to support the confirmation of a possible trend change, or alternatively to identify if this is a possible fake-out that requires more time to observe.
What you’ll see when we start talking about options is that certain strategies already have the statistics compounded in your favour. The very same fact that determines pricing of options requires the market makers to estimate that particular instrument’s probability of exercise. So let them do the work and calculate all the variables and we just come in and use all that to our advantage, structuring suitable trades with the stats in our favor.
Which will we be looking at?
As highlighted on numerous occasions, depending on the type of trader you are, your ability to move between indicators, chart patterns and across various types of markets may be more prominent in some cases than others.
For what I am teaching you though, the truth is that you can afford to take a breather and relax.
A reminder that my ideal trading style covers the following broad areas:
OUR IDEAL TRADING STYLE = LONG TERM POSITIONING + MEDIUM TERM OPPORTUNISIC TRADES + BANKING
REGULAR “SHORT-TERM” SETUPS + OVERLAYED WITH SOME YIELD ENHANCED STRUCTURING
None of these require you to be at the tip of the knives’ edge. You don’t need to be there the minute the market makes a move to jump on
it.
For the most part all the various possible trade setups we will engage in are enough to position you to:
- Catch Major Trends
- Monetize interim break-out movements within this
Major Trend - Trade very specific and narrowly defined trade
set-ups - Bank some yield-enhancement trades skewed in favour
of the trend
Stacking your edges
The golden rule in trading is to protect your capital. It naturally follows then that the most conservative way in which to evaluate a signal to trade is to always maintain a position where that decision is only actioned (i.e. a trade is taken) if it can be confirmed or supported by two other indicators (at minimum one in certain circumstances).
Without the ability to “stack these edges” in our favour we would much rather pass on the opportunity or wait for all to be aligned before
moving.
As an example, ideally, we would want :
- The market to be in an existing trend
- Our proposed trade to be skewed in the same direction of this trend (or opposite when it comes to selling options)
- That the strength of the trend is still strong
- That the markets momentum still anticipates movement in the same direction
- The price action supports the view based on where the market is trading at that point, relative to the immediate period preceding
this possible entry point.
Our tools of choice
For each of the various components of our ideal trading strategy we shall be using different indicators. I am not going to go into detail of each here, but will do so once we physically get trading. For now, my aim is just for you to see the relative few indicators required to get going!
Just to clarify, the below list only summarizes the indicators, and not the instruments we will use to trade once we have identified a possible trade.
As a quick example, for stock trades in particular, we may want to use a “stock replacement strategy” (structured via the use of option) instead of the actual outright purchasing of the stocks. In other words, we simulate the economics of the trade without actually physically having to enter the trade with the underlying physical stocks.
Our goal in this case may be improving (amplify) the return on the expected movement of the stock by committing less capital to the trade and in doing so greatly increasing the expected return on capital used to enter the trade.
Or for currencies, we may even decide to overlay a trade with a hedge structured via the use of zero premium option structures, in which we pre-determine the maximum best and worst case the trade can turn out, irrespective of where the actual underlying price movement goes.
Don’t worry if this does not make sense now, it all will – I promise.
The only reason I mentioned this point is for you as a reminder that trading is not a one-sided coin, in fact it probably closer resembles a coin with 10 sides (if that was even possible).
So here’s our “go-to” list of core indicators.
LONG TERM POSITIONING
- Moving Average Cross Overs
- Price Crossing Moving Averages
- Seasonality indicators
MEDIUM TERM OPPORTUNISIC TRADES
- Donchian Channels
- Swing Days
- Seasonality indicators
BANKING REGULAR “SHORT-TERM” SETUPS
- Inside Days
OVERLAYED WITH SOME YIELD ENHANCED STRUCTURING
- Deep ITM covered calls or puts
- Getting “paid while you wait” entry and exit
strategies - Selling low delta strangles
A surprisingly short list right?
A reminder that this list only covers the basics, but those basics are by far enough to get you started. The plus side of all this of course is that by only having to master a few indicators you can see how much easier the decision to trade can possible be.
Happy trading!
The post How To Choose The Right Indicators appeared first on My Dad The Trader.
Source:: How To Choose The Right Indicators