Previous Story
How You Can Use Fibonacci for Forex Trading
Fibonacci numbers form the basis of some valuable tools for mechanical forex traders. Fibonacci ratios are especially useful for determining possible support and resistance levels for forex prices in the near future.
Traders like to find high-probability set-ups for trades. Yet, beyond simply trading in the same direction of the current trend, it’s difficult to systematically increase the chance of success without using at least one predictive indicator.
Most indicators are lagging indicators, but Fibonacci ratios can be truly predictive. Unlike the commonly-used lagging indicators, Fibonacci numbers can help make predictions about future price moves regardless of the underlying trend.
Fibonacci indicators seem to be especially effective indicators for trading the EUR/USD and GBP/JPY currency pairs. And, time frames of one day work best for me. Time frames of one hour and four hours will also work, although they require a range of other indicators to show appropriate confirmation.
I’ve enjoyed good success in using Fibonacci calculations along with a few other carefully-chosen indicators in my mechanical trading strategies.
The significance of Fibonacci numbers
Fibonacci numbers are sequences of mathematically-useful numbers that consistently occur in nature as well as in finance. These sequences are very common in plants – Many trees and other plants form their arrangements of sprouts, leaves, fruits and branches according to Fibonacci sequences
These numbers are named for Leonardo Fibonacci, an Italian mathematician born in the 12th Century. During his childhood and early adulthood in North Africa, Fibonacci learned the Arabic-Hindu numeral system. He focused on performing math calculations using Arabic numbers since they were easier to work with than the Roman numerals (I, II, III, IV, V etc.) being used in Europe at that time.
In 1202, Fibonacci introduced his now-famous sequence of numbers to European mathematicians and scientists, along with a trove of other Indian and Arabic mathematical tools in his book titled Liber Abaci (Book of Abacus, or Book of Calculations).
Fibonacci’s teachings were well-received in Europe. The earliest applications of his work included formulas for commercial accounting and bookkeeping, the calculation of interest, the conversion of standard weights and measures, and other arithmetic tools.
Today, Fibonacci numbers continue to be used to calculate the “Golden Ratio” as well as the “Golden Rectangle,” which are incorporated as a rule of artistic-design proportion for many works of art, buildings and furniture.
Under the rules of the Golden Rectangle, for example, the ratio of the long side of the object when compared to the short side will usually be 1.618 or similar.
This proportion is believed to be very aesthetically pleasing to the human eye, and is therefore often used for design purposes. There are several Golden Ratio proportions, all based on Fibonacci values for their dimensions.
Other uses for Fibonacci numbers include computer algorithms for Internet searches, and methods for connecting distributed and parallel electronic systems. As well, Fibonacci ratios are used by savvy traders in search of predictive indicators.
How to calculate Fibonacci numbers
In mathematics, Fibonacci numbers include the following sequence of integer numbers: 0, 1, 1, 2, 3, 5, 8, 13, 21, 34, 55, 89, 144, 233, 377 and so on. The beginning two numbers may be designated as either 0 and 1, or 1 and 1, depending on the chosen starting point.
Fibonacci sequences show interrelationships: Each subsequent number in the series will be the sum of the previous two numbers. And, any particular number in the sequence will be about 1.618 times the size of the previous number.
Stated mathematically, a sequence Fn of Fibonacci numbers is calculated as:
Fn = Fn-1 + Fn-2 and F(0) = 0, and F(1) = 1
Stated in fractions, for example, the closest rational values used to calculate the Fibonacci Golden Ratios are 3/2, 5/3, 8/5, 13/8, 21/13, and 34/21.
So, when calculating the dimensional percentages of Fibonacci values for integer fractions the values are always around 61.8%, for example:
• Eight divided by 13 is 61.5%
• Thirteen divided by twenty-one is 61.9%
• Twenty-one divided by thirty-four is 61.7%
The Fibonacci ratio of 61.8% represents the Golden Mean or Golden Ratio. This is generally the most-reliable retracement ratio when trading Fibonacci retracements. I program my mechanical trading system to focus on the predictive power of this 61.8% ratio.
The two other Fibonacci ratios commonly used in forex trading are 23.6% and 38.2%, which are often used for purposes of calculating shorter-term retracements, and stop-loss or trailing-stop levels.
During a strong trend, a minimal retracement would be predicted at about 38.2% and during a weaker trend a retracement would be expected at about 61.8%. Of course, a full retracement would be 100%, which would nullify the current move.
Beyond the three retracement levels mentioned above, many forex traders also use Fibonacci retracements at 50% and 100%, which are shown as lines on the chart below.
It’s important not to confuse the different Fibonacci levels. When reconciling a Fibonacci level to the actual price action, be sure to use the same reference points each time for consistency. And, always keep the focus on trading in the general direction of the trend for the specific time period you are trading.
Fibonacci levels in forex trading
In forex trading, Fibonacci numbers help predict upcoming changes in price trends as well as potential retracement, extension and expansion levels. These indicators can be quickly calculated and easily progammed in expert advisor mechanical trading systems.
There are four Fibonacci studies commonly available in charting and trading software – Retracements, fans, arcs, and time zones – and retracements are the most consistent in producing better trading results.
A retracement refers to the tendency of the price of a forex pair or other asset to “correct” after an especially large move. Retracement levels are the price levels to which prices are expected to return after a short-term move contrary to the current trend.
During a retracement, the price encounters an area of support or resistance, and moves from an overbought or oversold condition back toward its current trend range.
Fibonacci retracements in forex trading offer a fairly-predictive indicator of near-future price levels. Fibonacci indicators are effective because, after a significant price move either up or down, very often the new resistance and support prices are near these levels.
On a graphic chart, Fibonacci retracements are shown as horizontal lines that indicate key support and resistance levels. These lines can be shown graphically by drawing various trendlines between extreme values, then dividing vertical distances by the main Fibonacci ratios.
When viewed on a chart, many of these opportunities look like head-and-shoulders and reverse-head-and-shoulders patterns. Best of all, they’re easy to spot using mechanical-trading software.
A well-designed expert advisor can use Fibonacci calculations with a mechanical trading strategy in order to make lightning-fast predictions about upcoming support and resistance levels.
Fibonacci levels for predicting retracements, extensions and expansions
I use Fibonacci ratios to identify trading opportunities and calculate suitable entry points. Fibonacci levels are especially helpful for identifying trades when emerging trends are likely to retrace back to their nearby highs or lows.
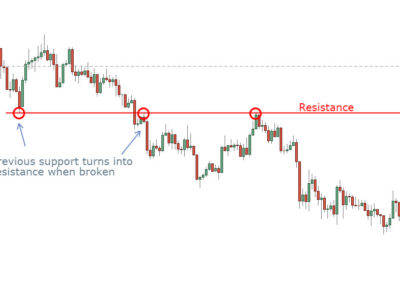
In the chart below, the GBP/JPY currency pair’s rate recently fell, then “tested” near the previous support level before once again moving upward. It’s easy to program a mechanical trading system so that trading orders are executed when prices reach Fibonacci retracement levels.

In the present example, the Fibonacci retracement lines indicate potential levels of support and resistance as the price appears set to continue moving upward. If the trend seems upward, yet the price is below a given retracement level, the next-higher Fibonacci ratio is a likely overhead resistance level.
During a downtrend, the opposite applies – The nearby Fibonacci levels indicate probable support levels at which forex traders will buy GBP/JPY, which may reverse the downtrend.
The most valuable uses for Fibonacci numbers are to determine likely retracement levels in the direction of the current trend, and to determine extension/projection levels in the future. Also, by using three pivot values, Fibonacci numbers can also be used to determine expansion targets for prices, too.
In addition to predicting retracements, Fibonacci numbers can also be used to calculate extensions. Extension levels are the prices which breakouts and other moves beyond the current range are expected to reach.
Stated mathematically, extensions are the moves beyond 100% of the given Fibonacci ratio. The most commonly used levels are 1.00 (100%), 1.272, 1.618, 2.00 (200%), and 2.618.
For example, to find the extension level during a new downtrend, a mechanical trading system will calculate the upcoming new support level at a low-to-high value greater than 100%, since the old support level was breached.
As well, during a new uptrend, the system will run the high-to-low extension in order to determine potential resistance levels; these can be used as profit targets or trailing stops.
The third main way of using Fibonacci numbers in forex trading is to calculate expansion price levels. Expansion price targets are determined by using three price points instead of two as used for calculating retracements and extensions.
For example, to determine expansion price levels for “buys,” the mechanical trading system uses two major lows and one major high in order to calculate resistance. To calculate target support levels for “sell” positions, the system uses two major highs and one major low price. The most common price levels used for expansions are 1.618, 1.00 and 0.618.
Risk management and volatility
The longer the time period used to signal the trade, the less will be the risk from general volatility. Retracements over short time periods are less reliable than those over longer periods. As indicated above, I prefer to trade based on daily price data instead of hourly or four-hour numbers.
Volatility can greatly affect short-term pricing. It may skew resistance and support levels, and cause whipsaws and spikes. It may seem difficult to determine which level of Fibonacci retracement should rule the expert advisor’s actions.
Setting the rules for stop-loss and trailing-stop orders requires caution – Short-term retracements may be narrow. If used carefully, Fibonacci retracements can be used to set stop-loss limit orders.
As an example, if price is trending up and I’m in a long position, my software would place a stop-loss order just below the price’s latest low swing. This may become a new level of price support or recovery, or set a new trading range before the price once again falls through its earlier level of support.
By setting the mechanical trading system’s rules to enter a stop-loss order just slightly under the appropriate Fibonacci retracement level, I can participate in most upward breakouts without overextending risk limits.
In a “short” trade during a downtrend, the system uses a stop-loss trigger set at a price slightly over the high swing of the retracement, since this is a likely resistance level. By setting the stop-loss orders just beyond the latest far swing, whether long or short, it means the stop-loss order will be triggered only if resistance/support is truly broken.
Likewise, trailing stops can be set using short-term Fibonacci retracement levels. The potential retracement levels are calculated by the mechanical trading system in real time, using the next-lower-order Fibonacci ratios. That way, the trade is closed out when the price move has run its course, but while the trade is still profitable.
As for position size, I use no more than 2% of account equity for each non-correlated trade. And, my mechanized trading system allocates no more than 1% of equity to each of two correlated trade opportunities, for example, two concurrent trades in correlated currency pairs.
I’ve found it best not to rely on Fibonacci-based signals alone. The retracement signals work better alongside momentum indicators. Fibonacci ratios offer reliable set-ups for trades, and I program my mechanical trading system to use other indicators for confirmation.
Short-term trading signals should always be considered in terms of long-term trends. Momentum indicators help confirm that I’m trading in the correct overall direction of the market. As well, you can also use MACD or stochastic oscillators with Fibonacci ratios to confirm entry points.
Fibonacci forex trading
Fibonacci ratios are useful for predicting natural, organic retracement and extension levels for forex prices. When used with momentum indicators and other tools for confirmation, they offer valuable predictive clues about future price movements.
Are you currently using Fibonacci ratios? Let us know how in the comments below.
[adrotate banner=”65″]
Source: Fibonacci for Forex Trading`