
Previous Story
Ichimoku cloud indicator analysis of EUR/USD for June 7, 2018
Posted On 07 Jun 2018
Comment: 0
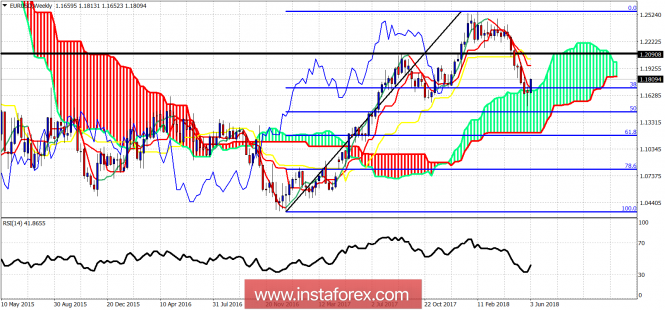
Today, we look at the weekly chart of EUR/USD. Why have we have been bullish about this pair?Pessimism was at its highest near 1.15-1.16 when everyone was talking about Italexit and expressed fears of the Eurozone break up.
Black line – horizontal resistance
At market peaks and bottoms sentiment is at extremes. The same was the case when EUR/USD was trading around 1.15. On a weekly basis, we have two very bullish signs. First, last week’s candle was a bullish hammer followed by a bullish week. Price bounced strongly off the 38% Fibonacci retracement and the upper weekly cloud boundary. Cloud support is held. If price manages to move back above the black horizontal resistance and the weekly kijun-sen, then we will have a very bullish setup. We remain bullish.
The material has been provided by InstaForex Company – www.instaforex.com
Source:: Ichimoku cloud indicator analysis of EUR/USD for June 7, 2018


