
Previous Story
Ichimoku cloud indicator analysis of Gold for April 30, 2018
Posted On 30 Apr 2018
Comment: 0
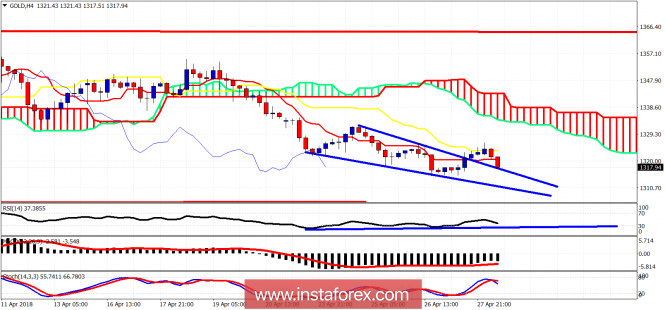
The gold price has broken above the downward sloping wedge pattern and is now back-testing it. Gold could make one more new lower low around $1,311 today before reversing its trend to the upside. The trend remains bearish as the 4-hour candlestick is still below both the tankan- and kijun-sen indicators.
Red line – resistance
Blue lines – wedge pattern
Upward sloping blue line – bullish divergence
The gold price has short-term support at $1,311 where we find the lower wedge pattern boundary. $1,320-24 is short-term resistance. In case of a break above it, we could see a test of the 4-hour cloud at $1,333. The short-term trend changes to bullish on a break above $1,338. I prefer to get bullish on gold around $1,310-$1,300 or with a break above $1,324. I expect the gold price to bounce soon.
The material has been provided by InstaForex Company – www.instaforex.com
Source:: Ichimoku cloud indicator analysis of Gold for April 30, 2018


