
Previous Story
Ichimoku cloud indicator analysis of gold for December 15, 2017
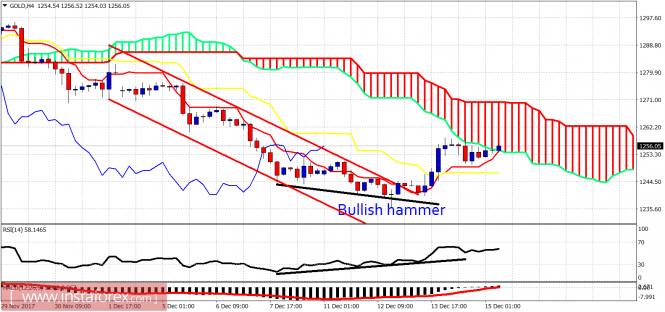
Gold price is trading near its weekly highs after bouncing from $1,237. We warned Gold bears that a bounce towards cloud resistance was coming. The market delivered what was expected. Now Gold is being tested at important short-term resistance.
Red lines – bearish channel
Gold price has bounced as expected, because price broke out of the bearish channel and the RSI was giving bullish divergence signs. Gold price has reached the bounce target at the 4-hour Kumo (cloud) resistance. A rejection here will most probably push Gold price towards $1,200. Support is at $1,250 and next at $1,246.
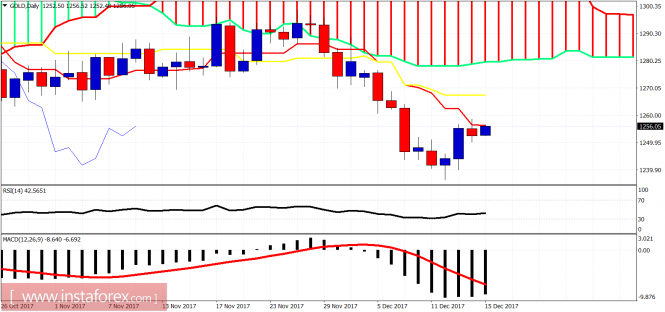
On a daily basis, Gold price is testing the tenkan-sen (red line indicator). A daily close above it will open the way for a move towards the kijun-sen (yellow line indicator) at $1,268. Daily trend remains bearish and this upward move is still considered as a bounce. I prefer to be neutral at the current levels or slightly bearish if price breaks below $1,250.The material has been provided by InstaForex Company – www.instaforex.com
Source:: Ichimoku cloud indicator analysis of gold for December 15, 2017


