
Previous Story
Ichimoku cloud indicator analysis of gold for January 22, 2018
Posted On 22 Jan 2018
Comment: 0
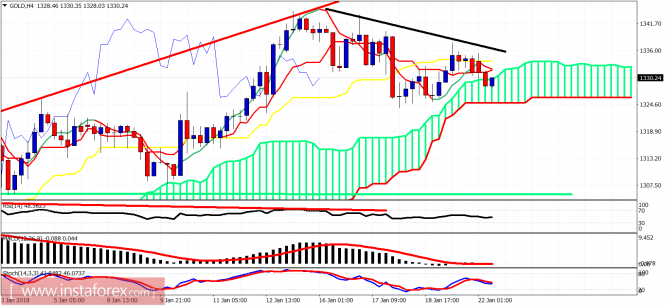
Gold is making lower lows and lower highs since the high of $1,345 in the 4-hour chart. Trend remains bullish though as price continues to hold above the 4-hour Kumo (cloud).
Red lines – bearish divergence
Green line – important support
Black line- short-term resistance
Gold price is trading right above the Kumo (cloud) in the 4-hour chart. Price is testing cloud support. Short-term support is at $1,325 and resistance at $1,337. A break below $1,235 could push price towards the green line support at $1,309. A break below the cloud will change trend to bearish for the short-term.
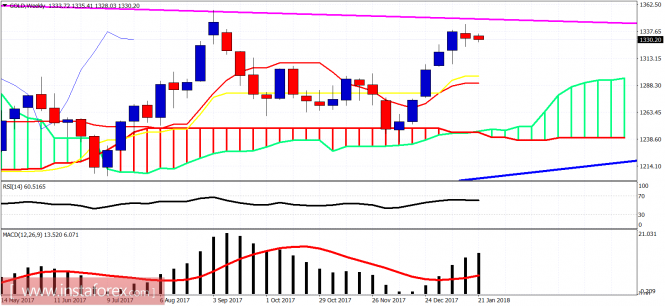
Magenta line -long-term resistance
The weekly candle implies the rejection was not very strong but price was rejected and we could see another lower weekly candle this week. Price has weekly support at $1,290 and next at $1,250. I’m bearish Gold. Key support is at $1,309, break it and we are off to $1,290-$1,250.
The material has been provided by InstaForex Company – www.instaforex.com
Source:: Ichimoku cloud indicator analysis of gold for January 22, 2018


