
Previous Story
Ichimoku cloud indicator analysis of gold for January 31, 2018
Posted On 31 Jan 2018
Comment: 0
Gold price remains near the monthly highs. Price got rejected at the long-term resistance of $1,350 however there is no confirmed reversal here yet. A rejection at the long-term resistance could start a new downward move back below $1,300, if however price manages to recapture the $1,350-55 level, we should expect the resumption of the up trend towards $1,390.
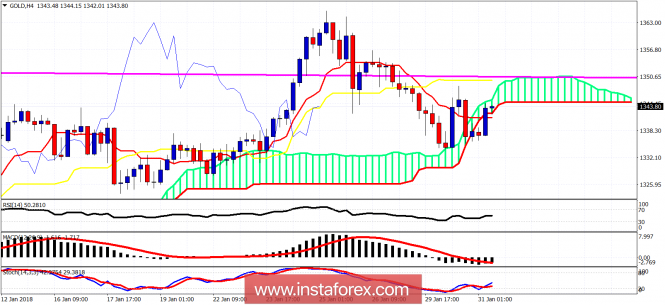
In the 4-hour chart Gold price has broken below the Ichimoku cloud and is trying to climb back up. Resistance is at $1,350. Break above it and Gold will be most probably going for new highs in 2018 towards $1,380-90. Support is at $1,334. Break below it and we could be heading towards $1,320-$1,300.
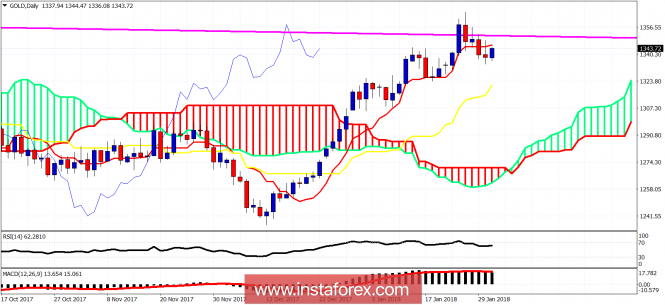
On a daily basis, Gold price got rejected at the long-term resistance and has closed below the tenkan-sen. This implies that as long as we are trading below $1,346 we should be going towards the kijun-sen (yellow line indicator) at $1,321. Break below it and we go towards the cloud at $1,300-$1,290.The material has been provided by InstaForex Company – www.instaforex.com
Source:: Ichimoku cloud indicator analysis of gold for January 31, 2018


