
Previous Story
Ichimoku cloud indicator analysis of Gold for March 26, 2018
Posted On 26 Mar 2018
Comment: 0
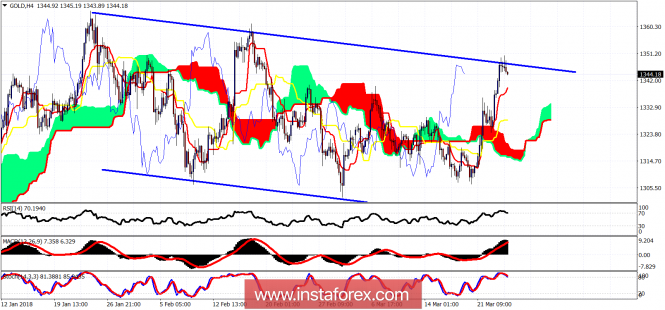
The Gold price has stuck again at the long-term resistance of $1,350-60. The price shows rejection signs as expected. Bulls should be very careful as we could see another pullback towards $1,300-$1,310 before the next move higher.
Blue lines – sideways channel
The Gold price is trading above the Ichimoku cloud in the 4-hour chart. The trend is bullish but the price has not broken above the upper channel boundary and above the February highs. Until then we remain sellers near resistance of $1,350 and buyers around the $1,300. Support by the cloud is at $1,320. Break it and we could test the lower channel boundary.
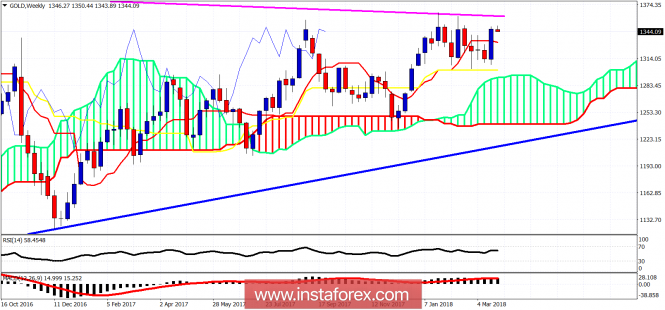
Magenta line – long-term resistance
Blue line – long-term support
On a weekly basis, the trend remains bullish, although we have not seen any real progress for the last month after reaching $1,360 area in January. The good news for bulls is that price continues to respect and hold above the weekly kijun-sen and the weekly Kumo (cloud). The bad news is that we are still below the magenta trend line resistance. I believe that eventually, we will break this trading range to the upside and finally make a move above $1,400.
The material has been provided by InstaForex Company – www.instaforex.com
Source:: Ichimoku cloud indicator analysis of Gold for March 26, 2018


