Previous Story
Ichimoku cloud indicator analysis of USDX for December 19, 2017
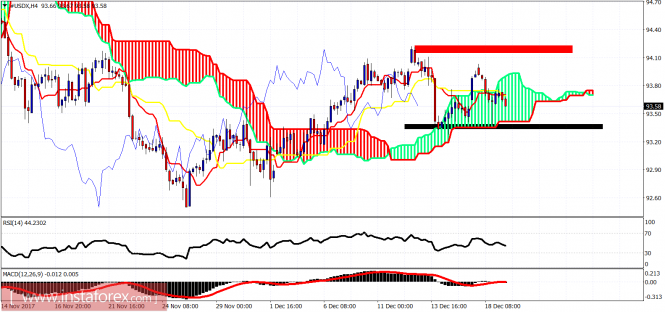
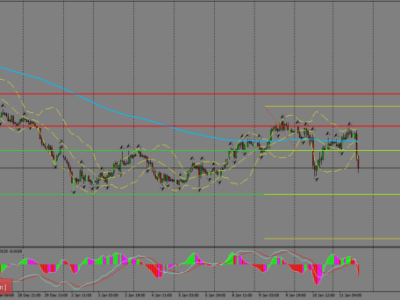
The Dollar index got rejected once again at the 94 price level and is testing short-term support at 93.30. So far price is trading sideways trapped inside the trading range of 94-93.
Red rectangle – resistance
Black rectangle -support
The Dollar index is trading inside the 4hour Kumo (cloud) .Trend is neutral. Price bounced off the cloud support (black rectangle) but bulls are not strong enough to push price back above the Kumo (cloud). Price is below both the tenkan- and kijun-sen indicators. This is a bearish sign, increasing the chances of breaking the black rectangle support level.
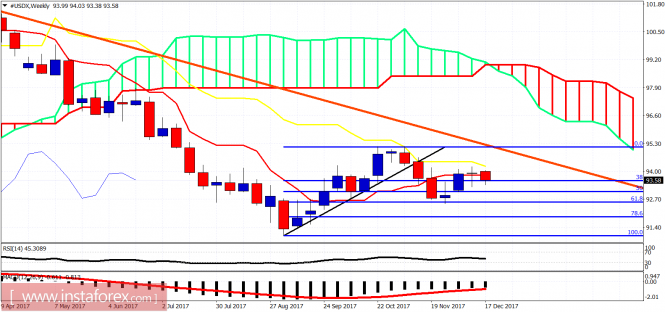
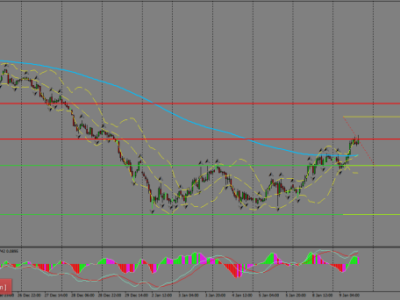
On a weekly basis price has bounced off the 61.8% Fibonacci retracement as expected but so far is unable to break above the resistance of the kijun-sen (yellow line indicator). Support is at 93-92.50 and if this level is broken we should expect price to move towards 91. Resistance at 94 is crucial for bulls. Break it and we go towards 96-97.The material has been provided by InstaForex Company – www.instaforex.com
Source:: Ichimoku cloud indicator analysis of USDX for December 19, 2017