
Previous Story
Ichimoku cloud indicator analysis of USDX for February 28, 2018
Posted On 28 Feb 2018
Comment: 0
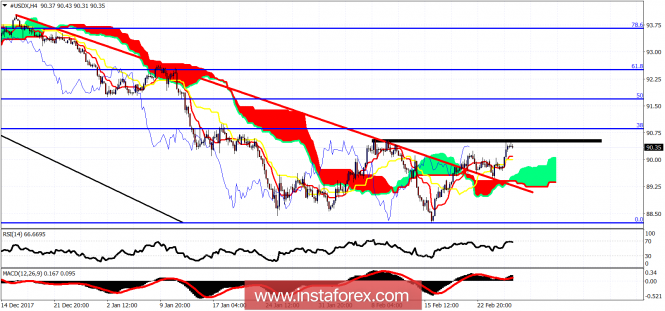
As we mentioned yesterday the Dollar bounced off the critical support area but price remains below the recent high at 90.60. Only a break above this level will confirm that a bigger bounce is in play for the Dollar index. The chances of this break out have increased dramatically.
Red line – resistance trend line (broken)
Black rectangle – horizontal resistance
The Dollar index is in a bullish short-term trend as price is trading above the Kumo (cloud) and above both the tenkan- and kijun-sen indicators. Resistance is found at 90.60. Support is at 89.60-89.50.
Blue line – resistance
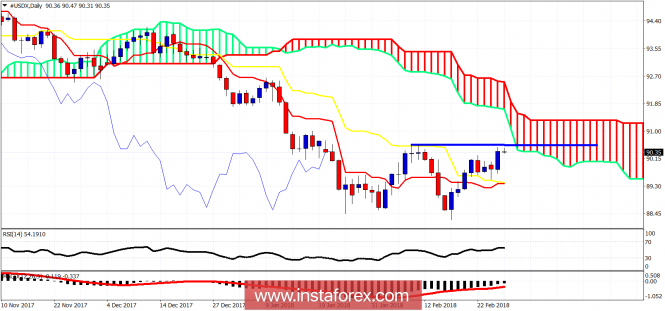
On a daily basis the Dollar index is above both the tenkan- and kijun-sen indicators. Price is below the cloud and below the blue trend line resistance. Cloud resistance that bulls must overcome is at 91-91.70. This is strong daily resistance. A break above this area will be an important bullish signal. I’m bullish about the index as long as price is above 89.50.
The material has been provided by InstaForex Company – www.instaforex.com
Source:: Ichimoku cloud indicator analysis of USDX for February 28, 2018


