
Previous Story
Ichimoku cloud indicator analysis of USDX for January 3, 2018
Posted On 03 Jan 2018
Comment: 0
The Dollar Index remains in a bearish trend. There are some signs of a short-term reversal but the most possible scenario remains the bearish one since we broke below 92.50. Only a break above 93-93.50 could bring back the bullish scenario for a move towards 97.
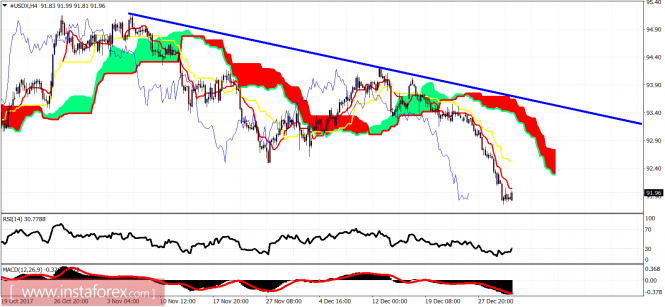
The blue line is the resistance trend line
The price is below both the tenkan- and kijun-sen indicators. Trend is clearly bearish. First short-term resistance is at 92.06 and the next one is at 92.52. Support is at 91. Cloud resistance is at 93.10. Only a break above that level could give the dollar bulls some chances for a larger move higher.
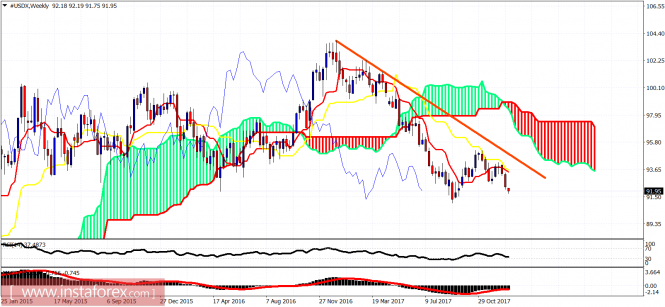
The red line is the long-term resistance
The weekly chart remains bearish implying that we should expect the price to move below 91 or even 90 before any bigger bounce. Weekly resistance is at 93.65 and we need a weekly close above it in order for the bulls to take control of the trend.
The material has been provided by InstaForex Company – www.instaforex.com
Source:: Ichimoku cloud indicator analysis of USDX for January 3, 2018


