
Previous Story
Ichimoku cloud indicator analysis of USDX for January 4, 2018
Posted On 04 Jan 2018
Comment: 0
NZD/USD is rebounding and is expected to trade with a bullish outlook. The pair has clearly reversed up and is now heading upwards to 0.7150.
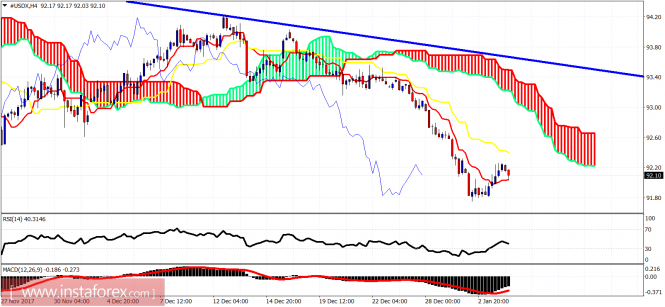
Blue line – long-term resistance
The US dollar index has managed to move above the 4-hour tenkan-sen. The price, however, remains in a bearish trend. Short-term resistance is at the kijun-sen at 92.40. Short-term support is at 92. Trend is bearish. The trend will change to bullish only if price breaks above the Kumo resistance at 93-93.40.
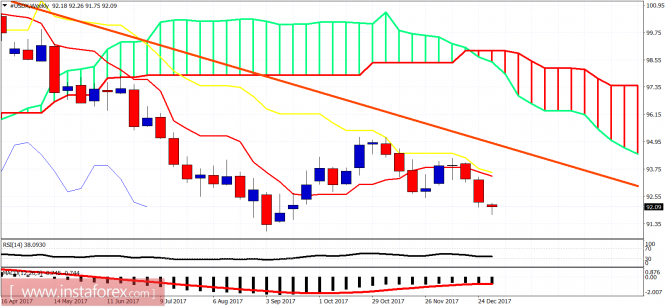
On a weekly basis, we could be forming a weekly bullish hammer reversal candle. A weekly close above 92.20 will be positive for the next week. A weekly close at the lows of this week will be a bearish sign for the next week. Weekly resistance is very important at 93.65. Break above it and we are off to 97.The material has been provided by InstaForex Company – www.instaforex.com
Source:: Ichimoku cloud indicator analysis of USDX for January 4, 2018


