
Previous Story
Ichimoku cloud indicator analysis of USDX for March 1, 2018
Posted On 01 Mar 2018
Comment: 0
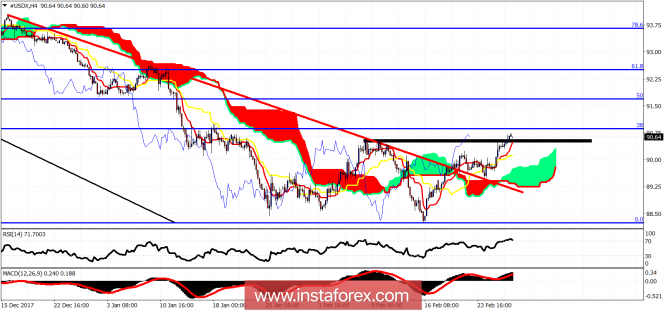
The Dollar index has broken through the previous high at 90.60. Short-term trend remains bullish. Next important resistance is found at 90.85 where we find the 38% Fibonacci retracement.
Red line – resistance (broken)
Black line – resistance (broken)
The Dollar index is breaking above the short-term resistance levels and continues to trade above both the tenkan- and kijun-sen indicators. Support is at 90.10 and at 89.80. Bulls do not want to see these two levels broken. Above the 38% Fibonacci retracement resistance, we have the 91.75 and 92.45 levels as very important resistance levels.
Blue line – resistance (broken).
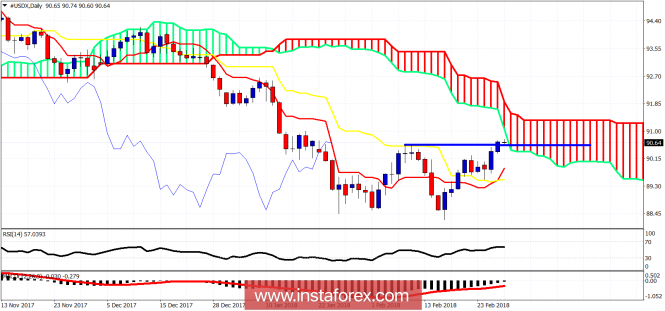
Daily trend remains bearish as price remains below the Kumo. Price is now challenging cloud resistance in the Daily chart. Daily support is at 90.50-90.25 and at 89.80. Bulls need to be careful as we might see a rejection at the Daily cloud resistance.
The material has been provided by InstaForex Company – www.instaforex.com
Source:: Ichimoku cloud indicator analysis of USDX for March 1, 2018


