
Previous Story
Ichimoku indicator analysis of gold for July 7, 2017
Posted On 07 Jul 2017
Comment: 0
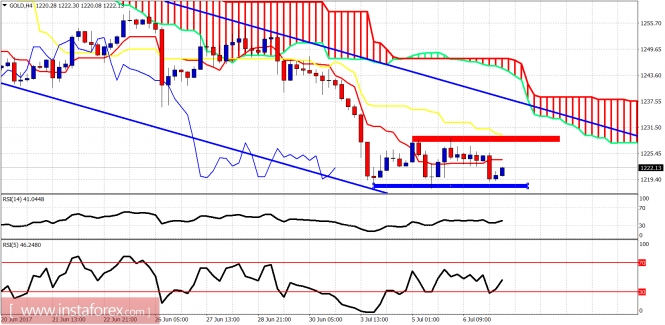
Gold price is consolidating above $1,210 and below $1,230. Price did not make a new overnight low as Silver did, while at the same time we observe bullish divergence signals by the oscillators.
Blue lines – bearish channel
Red rectangle – resistance
Blue rectangle – support
Short-term support is at $1,217. Resistance at $1,230. I believe we have more chances of breaking resistance and moving back towards $1,250-60. There we will see if we get another downward leg below $1,200 or break $1,300.
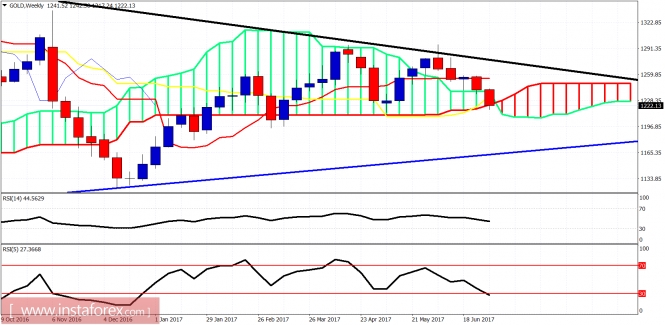
On a weekly basis price is testing the weekly Kumo (cloud). Breaking below the cloud will push price towards $1,180-60. Trend is neutral as price remains trapped between the black and blue trend lines. I remain longer-term bullish expecting Gold to eventually break $1,300 towards $1,400-$1,500. The $1,170-$1,200 price range is a gift for Gold bulls if we see it.The material has been provided by InstaForex Company – www.instaforex.com
Source:: Ichimoku indicator analysis of gold for July 7, 2017


