
Previous Story
Ichimoku indicator analysis of gold for June 1, 2017
Posted On 01 Jun 2017
Comment: 0
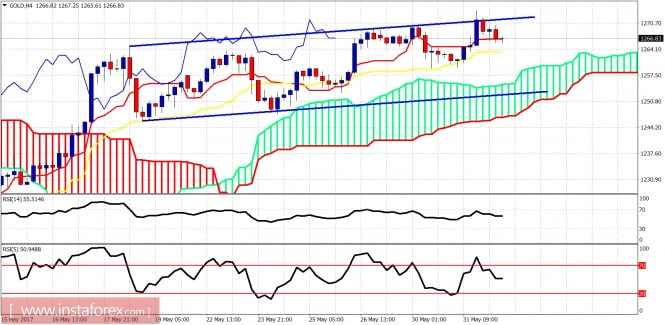
Gold price has reached the upper trading range boundary resistance and is pulling back down. Short-term traders could try and profit from short positions with tight stops at $1,275 as a pullback towards the lower boundary level is justified.
Blue lines – trading range
Gold price got rejected at the upper blue trading range boundary. Price remains above both the tenkan- and kijun-sen indicators. Trend remains bullish. As said in previous posts, we could see a slow grind higher but overall I expect price to pull back towards $1,255.
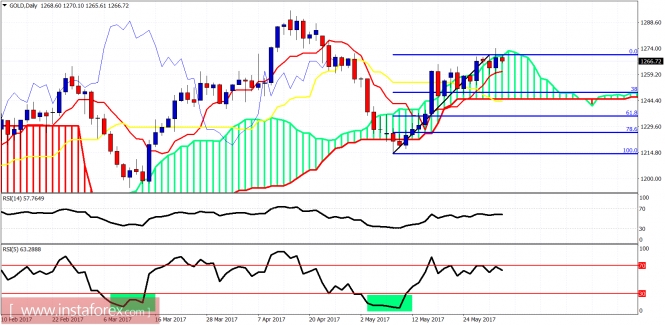
Gold price remains inside the daily Kumo (cloud). Trend is neutral. Price is expected to pull back at least towards the lower cloud boundary and just below the 38% Fibonacci retracement around $1,244. My longer-term view remains bullish but I do not see the bullish breakout to happen soon.The material has been provided by InstaForex Company – www.instaforex.com
Source:: Ichimoku indicator analysis of gold for June 1, 2017


