
Previous Story
Ichimoku indicator analysis of gold for June 23, 2017
Posted On 23 Jun 2017
Comment: 0
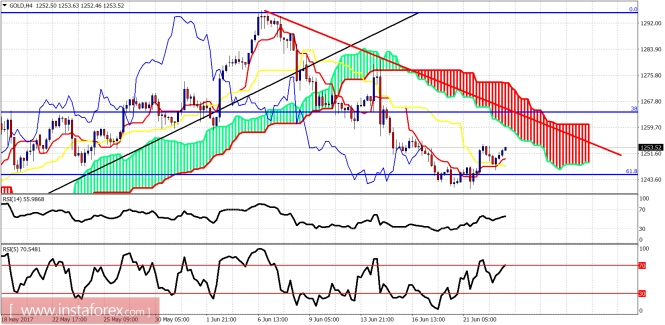
Gold is making higher highs and higher lows in the 4-hour chart and is unfolding the upward reversal we expect off the $1,245 price area. Gold is expected to continue the bounce towards $1,260 and higher. We could see a short-term new low towards $1,230 but it is not necessary.
Red line – resistance
Gold price is bouncing off the 61.8% Fibonacci retracement but remains below the red trend line resistance and the 4-hour Kumo (cloud). Price is above the tenkan- and kijun-sen indicators and this is a short-term bullish sign that the upside could continue.
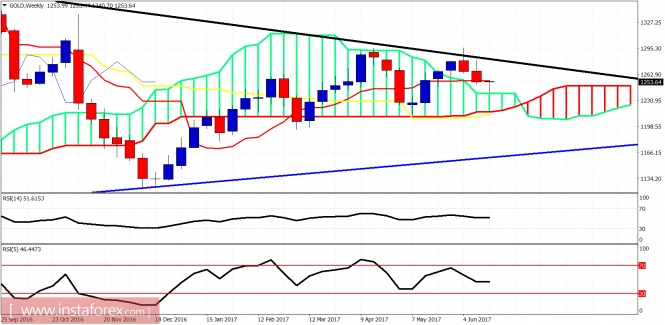
Black line -long-term resistance
Blue line – long-term support
Gold price remains trapped inside the weekly triangle pattern. Price got rejected again at the long-term resistance channel. Price has broken out and above the weekly Kumo and has successfully back tested the Kumo (cloud) support. A break above the black trend line will be a very bullish signal. It is not clear however if we first test the long-term blue trend line first or break right away.
The material has been provided by InstaForex Company – www.instaforex.com
Source:: Ichimoku indicator analysis of gold for June 23, 2017


