
Previous Story
Ichimoku indicator analysis of gold for May 11, 2017
Posted On 11 May 2017
Comment: 0
Gold price is still trading above $1,200-$1,210. Judging by the divergence signs, we suppose a bounce to at least $1,260 is very close.
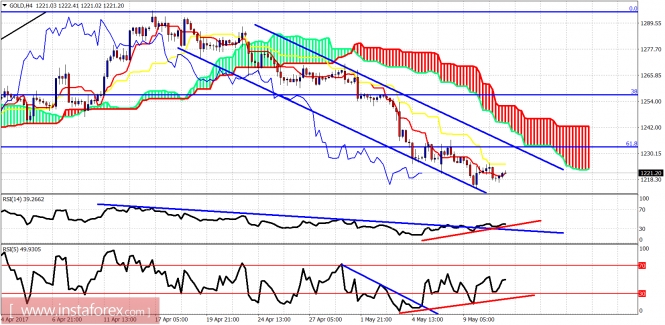
Blue lines – bearish channel
Red lines – bullish divergence
Gold price remains in a bearish trend but is trying to break above the kijun-sen indicator on the 4-hour chart. Price remains below the 4-hour Kumo (cloud). Resistance is at $1,237 and the next one is seen at $1,260.
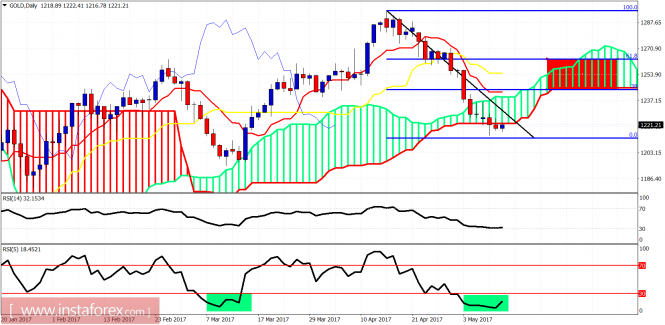
Red rectangle – target area
Gold price is expected at least to make a move towards the daily cloud and red rectangular area. This is where the 38% and 61.8% Fibonacci retracement levels are found. Only a strong break above this area will open the way for a move above $1,300. Otherwise, the upward move to $1,400 will be delayed and we might see $1,160 first.
The material has been provided by InstaForex Company – www.instaforex.com
Source:: Ichimoku indicator analysis of gold for May 11, 2017


