
Previous Story
Ichimoku indicator analysis of gold for November 13, 2017
Posted On 13 Nov 2017
Comment: 0
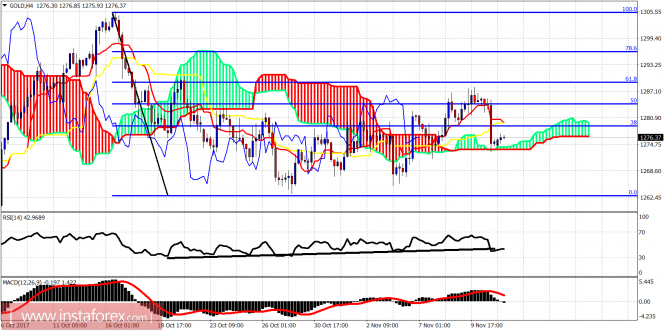
Gold price made a sharp reversal on Friday getting rejected once again at the $1,283-88 resistance area and where we also warned that the important 61.8% Fibonacci retracement was. Price has now tested the Ichimoku cloud support and is bouncing.
Gold has pulled back towards the 4 hour Kumo support and holds above it. Price is bouncing off that support. As long as price is above this support at $1,272, we remain short-term bullish. Breaking below it will open the way for a move to new lows towards $1,245-50. However if price makes a higher low here and moves higher towards $1,290, this would be a very bullish sign.
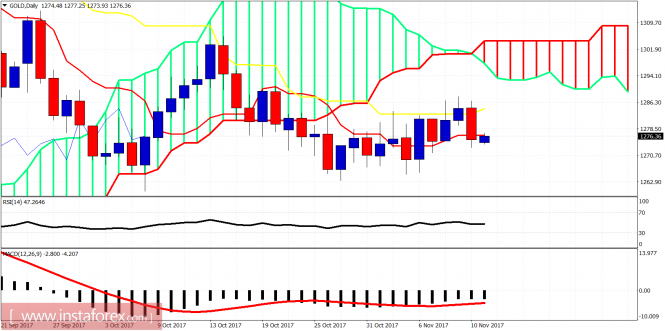
On a daily basis, the candle formation is bearish as price got rejected at the kijun-sen (yellow line indicator) and also closed below the tenkan-sen (red line indicator). Bulls need to break above last week’s high in order for price to move towards the Daily Kumo (cloud) resistance at $1,294-$1,301. Gold long-term view remains bullish. We have either started the upward move or we need one more final low towards $1,250.The material has been provided by InstaForex Company – www.instaforex.com
Source:: Ichimoku indicator analysis of gold for November 13, 2017


