
Previous Story
Ichimoku indicator analysis of gold for November 24, 2017
Posted On 24 Nov 2017
Comment: 0
Gold price remains inside the sideways channel just below important resistance levels. I continue to expect Gold to move lower towards $1,250 before resuming the longer-term upward move.
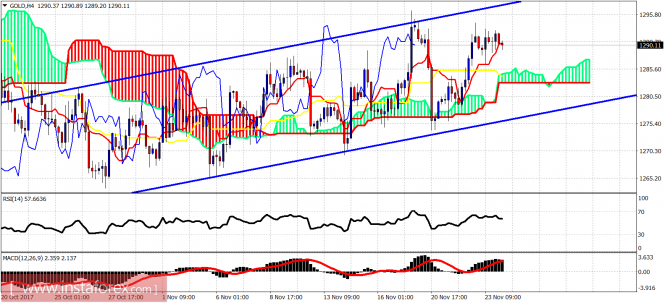
Blue lines – trading range
The Gold price is above the Ichimoku cloud in the 4 hour chart. This is a bullish sign. Support is at $1,285 and next at $1,277. Resistance is at $1,294 and next at $1,300. Gold is making an overlapping upward move since late October lows. This is not impulsive price action.
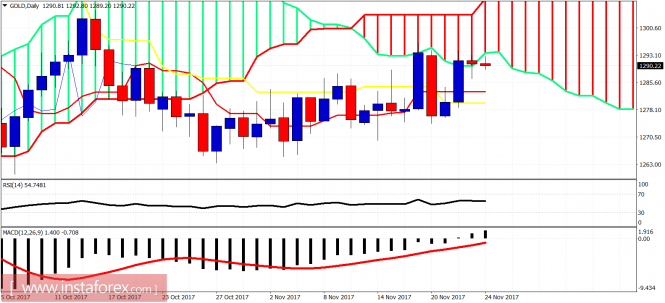
On a daily basis, the Gold price is testing the lower Kumo (cloud) boundary resistance. A rejection here will push price towards $1,280-78 daily support. A daily close below this support will open the way for a move towards $1,250. Breaking above $1,294 will open the way for a move towards $1,300.The material has been provided by InstaForex Company – www.instaforex.com
Source:: Ichimoku indicator analysis of gold for November 24, 2017


