
Previous Story
Ichimoku indicator analysis of USDX for July 7, 2017
Posted On 07 Jul 2017
Comment: 0
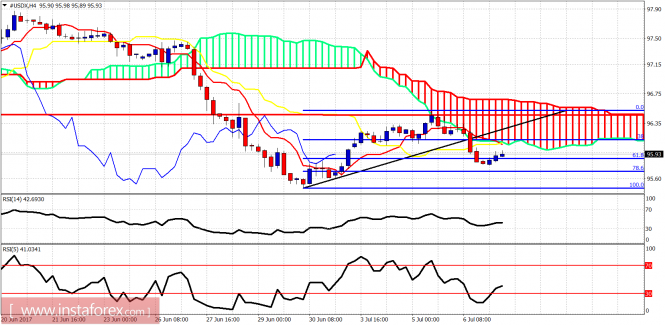
The Dollar index is making a higher low so far as the decline from the rejection at 96.50 has stopped around the 61.8% Fibonacci retracement. Trend remains bearish but I prefer to be on the lookout for a reversal.
Price is trading below both the tenkan- and kijun-sen indicators. Trend is bearish. But I believe we are in a process of making a higher low and then a new upward move should follow. Short-term resistance levels that need to be broken are at 96.30 and then at 96.55.
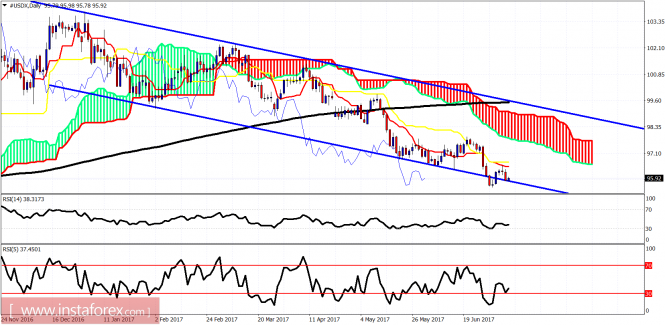
Blue lines – bearish channel
Trading for so long on top of the lower channel boundary implies that an explosive upward move will come. Trend is bearish as price is below the tenkan- and kijun-sen indicators. Breaking above them (96.50-96.70) will be a very bullish sign and push price towards 98-98.50.
The material has been provided by InstaForex Company – www.instaforex.com
Source:: Ichimoku indicator analysis of USDX for July 7, 2017


