
Previous Story
Ichimoku indicator analysis of USDX for May 11, 2017
Posted On 11 May 2017
Comment: 0
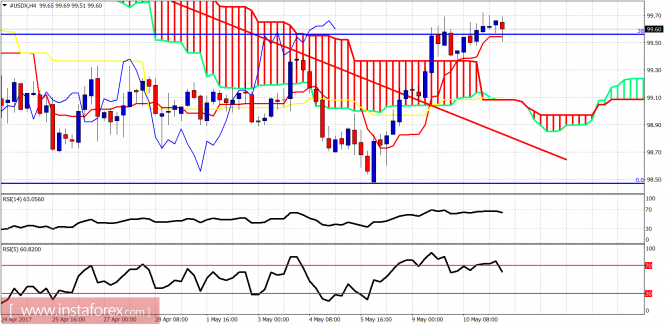
The Dollar index is trading around the 38% Fibonacci retracement of the decline from 101.35. I expect the Dollar index to move lower from current levels. The recent lows are expected to be tested.
In the short term, price remains above both the kijun- and the tenkan-sen. Support is at 99.54. If we see a 4-hour candle close below it, we should expect price to move towards 99.10 where the cloud support and the kijun-sen indicator are found.
Red line – resistance
Green line – support
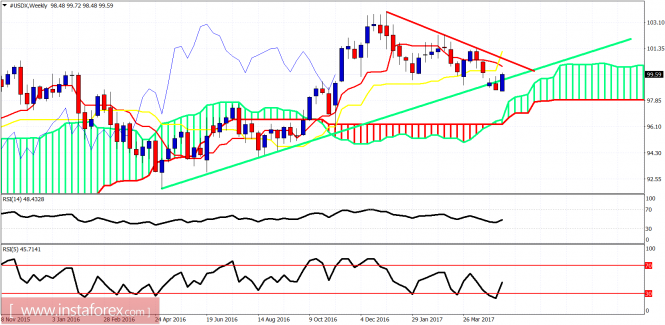
The Dollar index is trying to move back above the long-term trend line support. Resistance is found at 100.14 and 100.60 by the red trend line resistance. Bulls need to hold above this week’s lows and break above 100.60. A new weekly low will be a very bearish sign.
The material has been provided by InstaForex Company – www.instaforex.com
Source:: Ichimoku indicator analysis of USDX for May 11, 2017


