
Previous Story
Ichimoku indicator analysis of USDX for September 5, 2017
Posted On 05 Sep 2017
Comment: 0
Not much action was seen yesterday due to the US holiday. The US dollar index is moving sideways between 92.85 and 92.30. Daily trend remains bearish. A new lower low is expected before a bigger bounce.
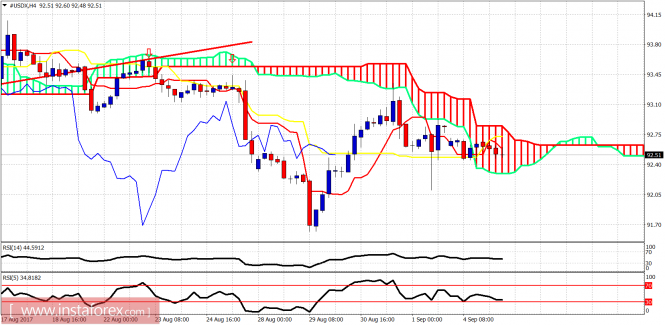
Price is moving lower but has entered the Ichimoku cloud on the 4 hour chart. Breaking above the cloud will open the way for a push higher towards 93.50. Support is found at 92.30. Breaking it will open the way for a push to new lows.
Red lines – bearish channel
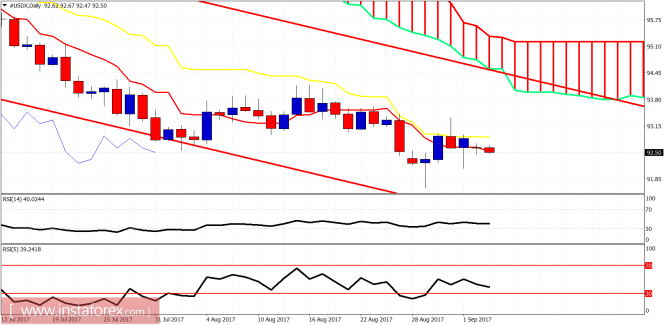
The US dollar index daily chart is not looking good as the price cannot break above the kijun-sen (yellow line indicator) and is now breaking below the tenkan-sen (red line indicator). This is a bearish sign. Trend remains bearish on a daily basis as long as price is below 95.10. A bounce towards 94-95 is expected once we make one more new low around 90.
The material has been provided by InstaForex Company – www.instaforex.com
Source:: Ichimoku indicator analysis of USDX for September 5, 2017


