
Previous Story
Indicator analysis. Daily review of GBP/USD on Apr 3, 2020
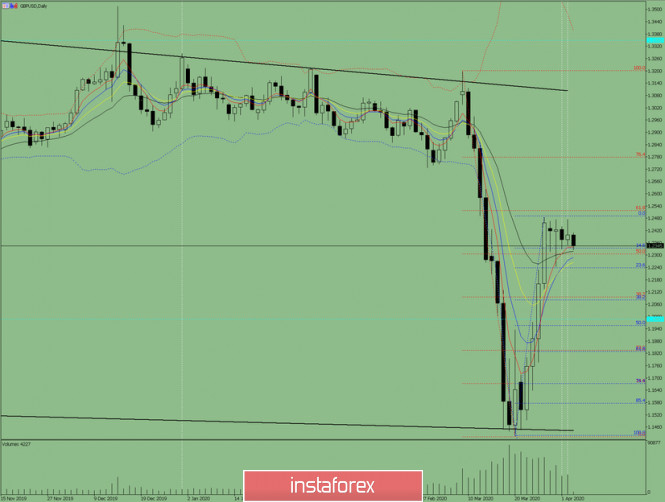
Trend analysis (Fig. 1).
Today, from the level of 1.2398 (closing of yesterday’s candle) the pair may begin to move down with the first target of 1.2238, a retracement level of 23.6% (blue dashed line). Upon reaching this level, the continuation of the downward work is with the target of 1.2081, a retracement level of 38.2% (blue dashed line).
Fig. 1 (daily chart).
Comprehensive analysis:
– Indicator analysis – down;
– Fibonacci levels – down;
– Volumes – down;
– Candlestick analysis – neutral;
– Trend analysis – up;
– Bollinger Lines – up;
– Weekly schedule – down.
General conclusion:
Today it is possible to move down with the first target of 1.2238, a retracement level of 23.6% (blue dashed line). Upon reaching this level, continued downward work with a target of 1.2081, a retracement level of 38.2% (blue dashed line).
An unlikely scenario: from a retracement level of 14.6% – 1.2333 (blue dashed line), work up with a target of 1.2518, a retracement level of 61.8% (red dashed line).
The material has been provided by InstaForex Company – www.instaforex.com
Source:: Indicator analysis. Daily review of GBP/USD on April 3, 2020


