
Previous Story
Indicator analysis. Daily review on Aug 29, 2019 for the EUR/USD currency pair
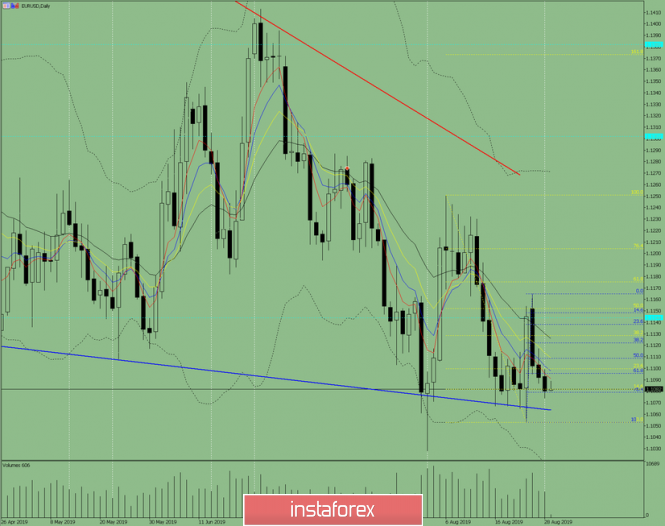
On Wednesday, the price continued to move down. Moving down, the price tested a pullback level of 76.4% – 1.1079 (blue dashed line) and closed slightly higher – 1.1080. Today, strong calendar news is expected at 7.55 Universal time (euro), 12.30 Universal time and 14.00 Universal time (dollar). Also today, the downward movement may continue.
Trend analysis (Fig. 1).
On Thursday, a downward movement with the target of 1.1063 is possible – the support line (blue bold line). There is a chance of breaking this line down, and then continue to the next target of 1.1053, which is the lower fractal.
Fig. 1 (daily chart).
Comprehensive analysis:
– indicator analysis – down;
– Fibonacci levels – down;
– volumes – down;
– candlestick analysis – up;
– trend analysis – down;
– Bollinger Lines – down;
– weekly schedule – down.
General conclusion:
On Thursday, a downward movement with the target of 1.1063 is possible – the support line (blue bold line). There is a chance of breaking this line down, and then continue to the next target of 1.1053, which is the lower fractal.
The equivalent scenario is an upward rebound from the support line and an upward movement with the target of 1.1100 – a pullback level of 23.6% (yellow dashed line).
The material has been provided by InstaForex Company – www.instaforex.com
Source:: Indicator analysis. Daily review on August 29, 2019 for the EUR / USD currency pair


