
Previous Story
Indicator analysis. Daily review on EUR/USD for May 11, 2020
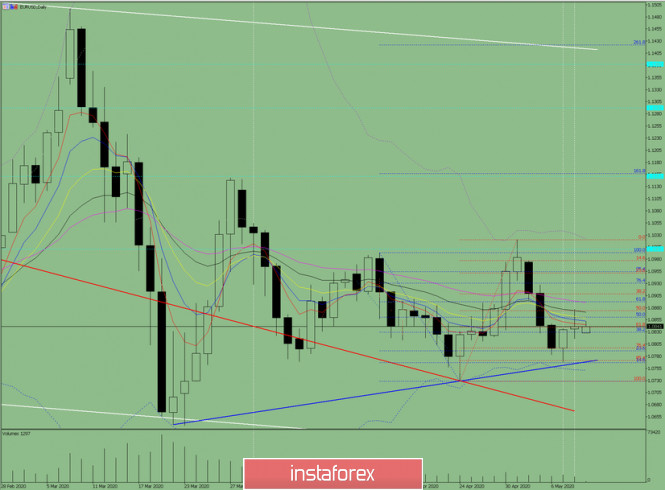
The pair traded downward on Friday as per technical analysis, however, the news forced the market to go up despite the rise to 20.5 million unemployed in the US. By the end of the day, the market had almost returned to its starting point. Upon moving upward, the price tested 21 average EMA at 1.0874 (presented in a black thin line) and then made a downward pullback. Today, the price may continue to move down. Nothing is expected from the economic news calendar.
Trend analysis (Fig. 1).
Today, the upward trend is likely to continue from the level of 1.0841 (closing of the Friday afternoon candle) with a target at 1.0861 – a 50.0% pullback level (presented in a blue dashed line). It is very likely that from this level, the price may move downward with a target at 1.0797 – an 85.4% retracement level (presented in a red dashed line).
Fig. 1 (daily chart).
Comprehensive analysis:
– Indicator analysis – down;
– Fibonacci levels – down;
– Volumes – up;
– Candlestick analysis – up;
– Trend analysis – up;
– Bollinger Lines – down;
– Weekly schedule – down.
General conclusion:
Today, the price may move downward with a target at 1.0797 – an 85.4% retracement level (presented in a red dashed line).
Another possible scenario is a bullish trend from 1.0861 – a 50.0% pullback level (presented in a blue dashed line) with a target at 1.0892 – a 61.8% pullback level (presented in a blue dashed line).
The material has been provided by InstaForex Company – www.instaforex.com
Source:: Indicator analysis. Daily review on EUR / USD for May 11, 2020


