
Previous Story
Indicator analysis. Daily review on EUR/USD for May 7, 2020
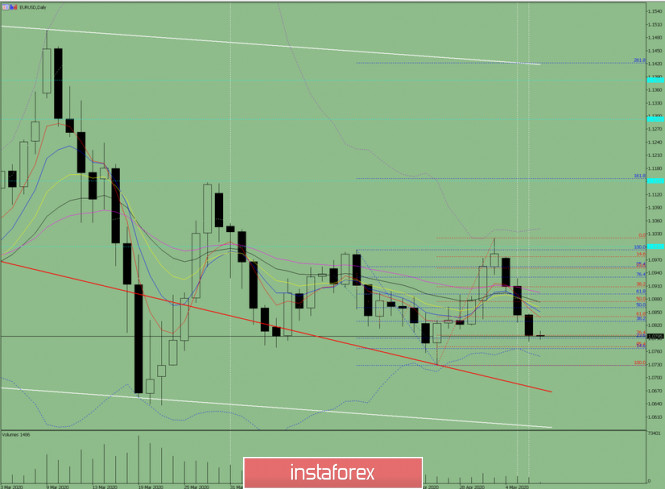
Trend analysis (Fig. 1).
Today, the downward movement is likely to continue from the level of 1.0796 (closing of yesterday’s candle) with the target at the lower fractal 1.0728 (presented in a red dashed line). From this level, the price may continue to move downward with the target at the support line 1.0674 (presented in a red bold line).
Fig. 1 (daily chart).
Comprehensive analysis:
– Indicator analysis – down;
– Fibonacci levels – down;
– Volumes – down;
– Candlestick analysis – down;
– Trend analysis – down;
– Bollinger Lines – down;
– Weekly schedule – down.
General conclusion:
Today, the price may continue to move downward with the target at the lower fractal 1.0728 (presented in a red dashed line).
Another possible but quite an unlikely scenario is a bullish trend from the level of 1.0771 – an 85.4% retracement level (presented in a red dashed line) with a target at 1.0861 – a 50% pullback level (presented in a blue dashed line).
The material has been provided by InstaForex Company – www.instaforex.com
Source:: Indicator analysis. Daily review on EUR / USD for May 7, 2020


