
Previous Story
Indicator analysis. Daily review on GBP/USD for July 15, 2020
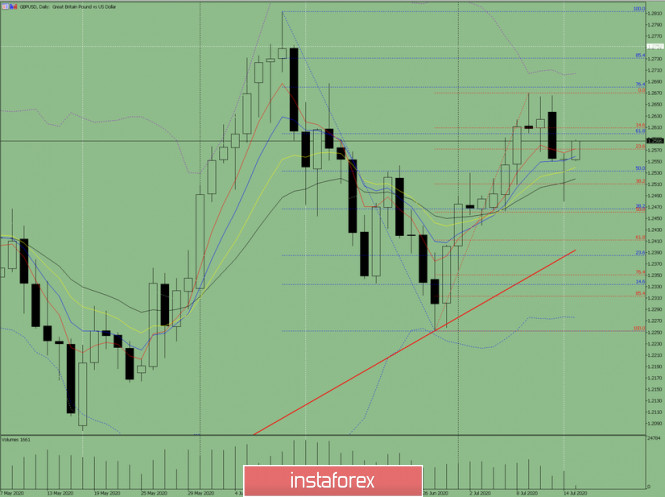
The pair moved on a downward trend on Tuesday, tested the pullback level 38.2% at 1.2511 (red dotted line), and after that the price went up, reaching the opening of the day. Today, the upward trend may continue. Economic calendar news for the dollar is expected at 14:30 UTC.
Trend analysis (Fig. 1).
Today, the upward trend may continue from the level of 1.2554 (closing of yesterday’s candle) with the target of 1.2599 – a 61.8% retracement level (blue dotted line). From this level, the upward trend may continue with the next target of 1.2681 – a 76.4% retracement level (blue dashed line).
Fig. 1 (daily chart).
Comprehensive analysis:
– Indicator analysis – up;
– Fibonacci levels – up;
– Volumes – up;
– Candlestick analysis – down;
– Trend analysis – up;
– Bollinger Lines – up;
– Weekly schedule – up.
General conclusion:
Today, the price may continue to move upward with the target of 1.2681 – a 76.4% pullback level (blue dotted line).
Another possible scenario is a downward trend after testing 1.2599 – a 61.8% pullback level (blue dotted line) with the target at the lower fractal 1.2480.
The material has been provided by InstaForex Company – www.instaforex.com
Source:: Indicator analysis. Daily review on GBP / USD for July 15, 2020


