
Previous Story
Indicator analysis. Daily review on GBP/USD for May 11, 2020
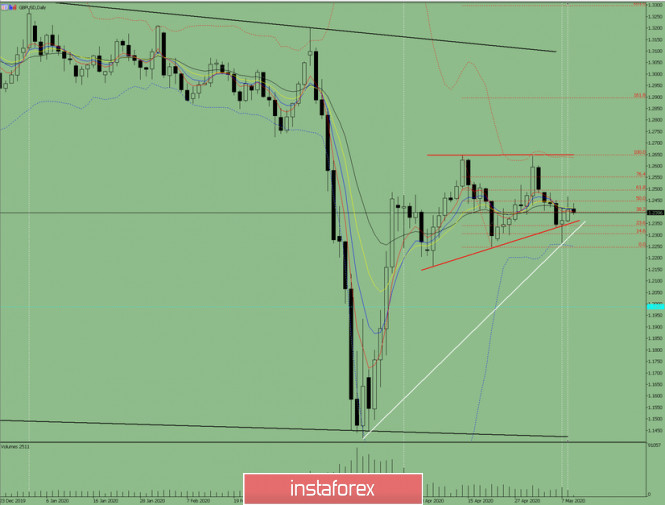
Trend analysis (Fig. 1).
Today, a downward pullback is possible from the level of 1.2410 (closing of the Friday afternoon candle) with a target at the support line 1.2315 (presented in a white thick line). If this line is reached, an upward pullback is possible with a target of 1.2447 – a 50.0% pullback level (presented in a red dashed line).
Fig. 1 (daily chart).
Comprehensive analysis:
– Indicator analysis – down;
– Fibonacci levels – down;
– Volumes – up;
– Candlestick analysis – up;
– Trend analysis – up;
– Bollinger Lines – up;
– Weekly schedule – down.
General conclusion:
Today, the price may move downward with a target at the support line 1.2315 (presented in a white thick line). Upon reaching this level, an upward pullback is possible.
Another possible scenario is a bullish trend from 1.2400 – a 38.2% pullback level (presented in a red dashed line) with a target at 1.2495 – a 61.8% pullback level (presented in a red dashed line).
The material has been provided by InstaForex Company – www.instaforex.com
Source:: Indicator analysis. Daily review on GBP / USD for May 11, 2020


