
Previous Story
Indicator analysis. Daily review on Sept 27, 2019 for the GBP/USD currency pair
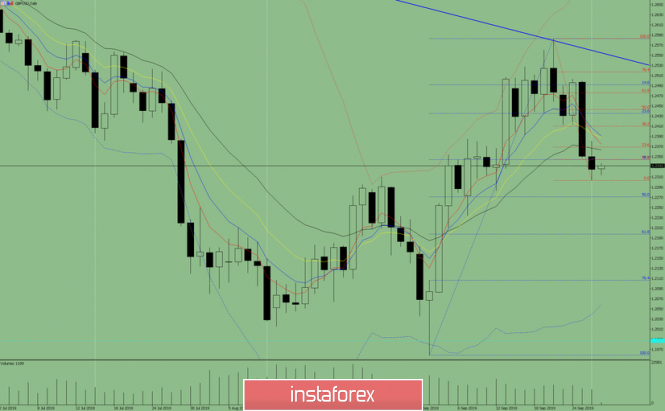
Trend analysis (Fig. 1).
On Friday, the price will move up with the first target 1.2344 – a pullback level of 14.6% (red dashed line). The price, in case of breaking through, can continue to move up with the target of 1.2370 – a pullback level of 23.6% (red dashed line).
Fig. 1 (daily chart).
Comprehensive analysis:
– indicator analysis – up;
– Fibonacci levels – up;
– volumes – up;
– candlestick analysis – up;
– trend analysis – up;
– Bollinger Lines – up;
– weekly schedule – up.
General conclusion:
On Friday, the price will continue to move up.
An unlikely scenario is a downward movement, with the first target at 1.2271 – a pullback level of 50% (blue dashed line).
The material has been provided by InstaForex Company – www.instaforex.com
Source:: Indicator analysis. Daily review on September 27, 2019 for the GBP / USD currency pair


