
Previous Story
Intraday technical levels and trading recommendations for GBP/USD for October 19, 2018
Posted On 19 Oct 2018
Comment: 0
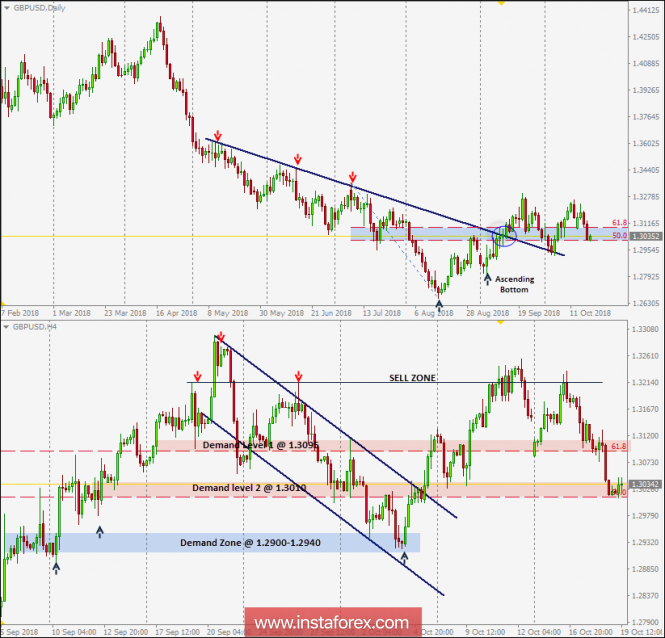
On September 13, the depicted daily downtrend line which came to meet the pair around 1.3025-1.3090 failed to offer enough bearish pressure on the pair. Since then, the GBP/USD pair has been demonstrating a successful bullish breakout so far.
On September 21, the GBP/USD failed to demonstrate sufficient bullish momentum above 1.3296. The short-term outlook turned to become bearish within the depicted H4 bearish channel to test the backside of the broken uptrend.
Recently, the price level of 1.2900-1.2940 (the backside of the broken uptrend) demonstrated significant bullish recovery which led to the recent bullish breakout of the depicted H4 channel.
Evident Bullish momentum was demonstrated above 1.3010 and recently above 1.3100 (61.8% Fibo level) which led to the recent bullish movement towards 1.3200.
Bearish rejection was demonstrated around 1.3200. This hinders the bullish breakout scenario allowing further bearish decline towards 1.3090 (61.8% Fibo level) and probably 1.3010 (50% Fibonacci level) if enough bearish pressure is applied.
As for the bullish breakout scenario to remain valid, bullish persistence above 1.3200 (SELL-ZONE) is needed to maintain sufficient bullish momentum initially towards 1.3280.
On the other hand, a bearish breakdown below the price level of 1.3100 (61.8% Fibo level) enhances further bearish decline towards 1.3010 and 1.2940.
The material has been provided by InstaForex Company – www.instaforex.com
Source:: Intraday technical levels and trading recommendations for GBP/USD for October 19, 2018


