
Previous Story
Intraday technical levels and trading recommendations for NZD/USD for June 16, 2017
Posted On 16 Jun 2017
Comment: 0
Daily Outlook
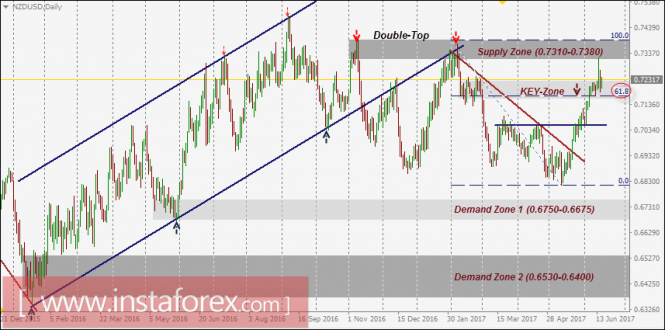
The NZD/USD pair has been trending-up within the depicted bullish channel since January 2016.
In November 2016, early signs of bullish weakness were expressed on the chart when the pair market failed to record a new high above 0.7400.
Bearish breakout of the lower limit of the channel took place in December 2016.
In February 2017, the depicted short-term downtrend was initiated of the depicted supply zone (0.7310-0.7380).
However, a recent bullish breakout above the downtrend line took place on May 22. Since then, the market has been bullish as depicted on the chart.
The price zone of 0.7150-0.7230 (SUPPLY-ZONE in confluence with 61.8% Fibonacci level) stood as a temporary Resistance-Zone until bullish breakout was expressed above 0.7230.
This resulted in a quick bullish advance towards the next Supply-Zone around 0.7310-0.7380.
As anticipated, Evident bearish rejection was expressed around 0.7310. This brought the pair again inside the previous congestion zone (0.7230-0.7150).
Trade recommendations:
Conservative traders can wait for a bearish closure below the current zone. Bearish closure below 0.7150 (61.8% Fibo level) indicates a valid SELL signal.
S/L should be placed above 0.7250 while T/P levels should be placed at 0.7050, 0.6970, and 0.6850.
The material has been provided by InstaForex Company – www.instaforex.com
Source:: Intraday technical levels and trading recommendations for NZD/USD for June 16, 2017


