
Previous Story
Intraday technical levels and trading recommendations for USD/CAD for May 31, 2017
Posted On 31 May 2017
Comment: 0
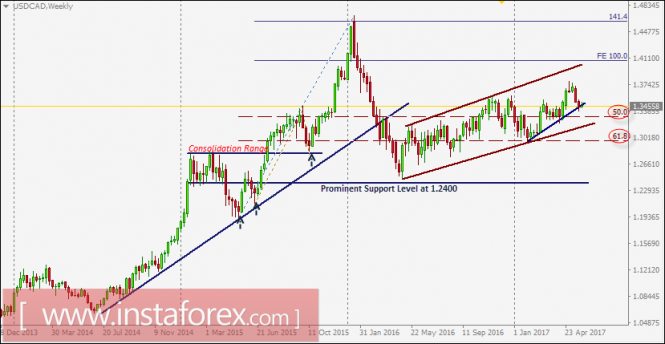
Since April 2016, the USD/CAD pair has been trending upward within the depicted ascending channel.
In December 2016, a bullish breakout above 1.3300 (50% Fibonacci level) was expected to allow a further advance toward 1.3700-1.3750 (the upper limit of the depicted channel).
However, a significant bearish rejection was expressed around 1.3580 (recently established top).
During the bearish pullback, the price level of 1.3300 (50% Fibonacci Level) failed to provide enough support to the pair.
This allowed a further bearish movement toward the price level of 1.2970 (61.8% Fibonacci level) where a valid BUY entry was offered in February 2017.
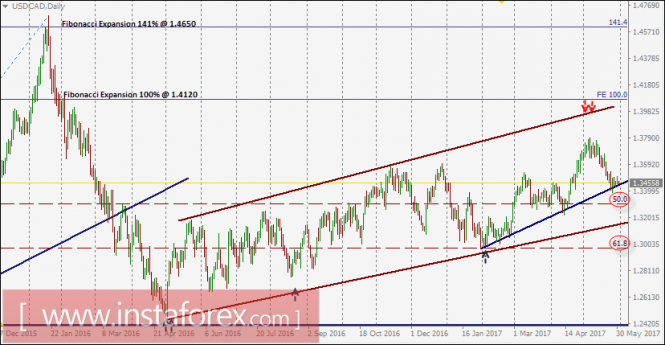
A few weeks ago, a bullish breakout above 1.3300 (50% Fibonacci Level) enhanced a further advance toward 1.3440 and 1.3580.
As long as the USD/CAD pair continues trading above 1.3450-1.3500 (confluence of prominent tops and the recent uptrend line), the market remains bullish. Otherwise, a bearish pullback should be expected towards 1.3300.
The expected bullish target would be located around 1.3950 and 1.4030 (the upper limit of the depicted channel and FE 100%).
The material has been provided by InstaForex Company – www.instaforex.com
Source:: Intraday technical levels and trading recommendations for USD/CAD for May 31, 2017


