
Previous Story
Local Demand For Euro Beginning to Show Signs of Weakness.
Posted On 12 Jun 2014
Comment: 0
For the readers’ benefit:
Price action confirmation: simply means traders will likely wait for price action to confirm a level by consuming the opposing supply or demand area, then entering a trade on a possible retracement, this may occur on the lower timeframes also.
Pending orders: means pending orders are likely seen.
EUR/USD:
4hr TF.
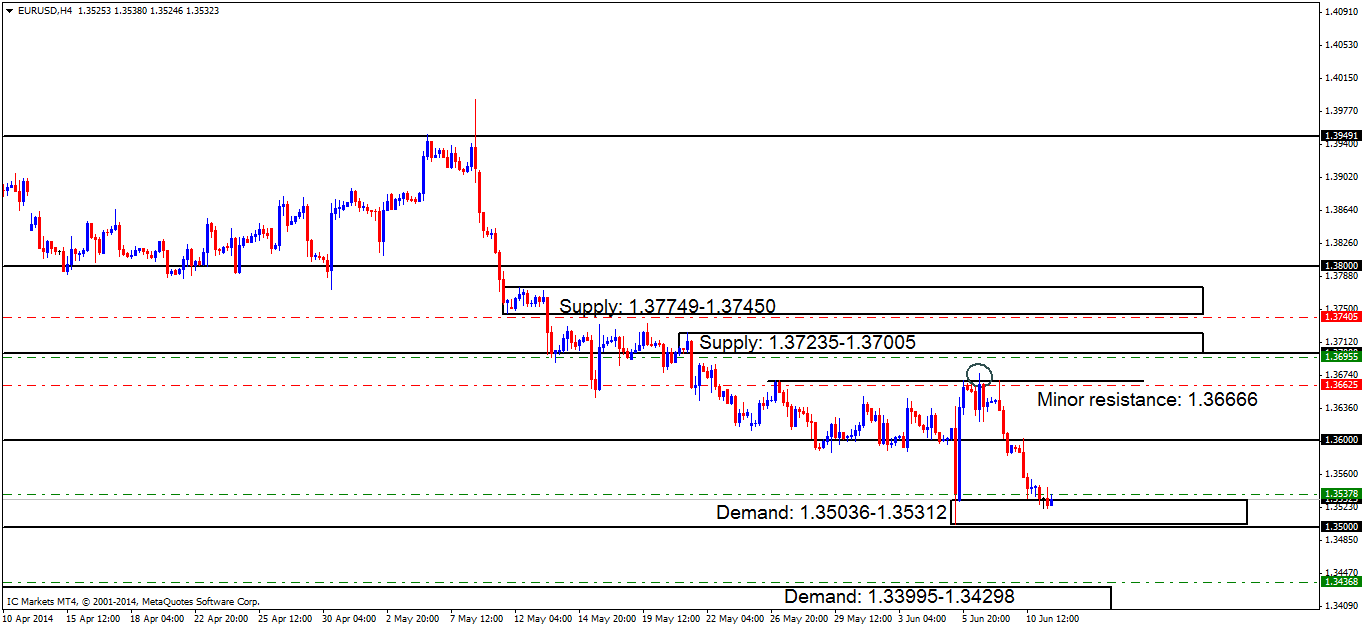
Demand at 1.35036-1.35312 is currently holding. Buyers are yet to show any convincing interest in taking prices higher which is a little concerning. If a break below is seen here, the next fresh demand area is at 1.33995-1.34298 (Chart 2).
Consuming 4hr demand at 1.35036-1.35312 would not be a good sign for buyers, as this is the last logical demand area left within weekly timeframe demand at 1.34770-1.36771.
- The Pending buy order (Green line) seen at 1.35378 just above demand at 1.35036-1.35312 is currently active, so keep a close eye on the first target area (reported below).
- New pending buy orders are seen around demand (1.33995-1.34298) at 1.34368. This demand area will more than likely see some sort of reaction due to its location seen to the left, marked with an arrow (Chart 1).
- Pending sell orders (Green line) seen at 1.36955 just below supply at 1.37235-1.37005 are set here since this level remains untouched, meaning unfilled orders are likely still set around this area.
- P.A confirmation sell orders (Red line) are seen higher up at 1.37405 just below supply at 1.37749-1.37450, this level requires confirmation because of how close the supply areas (levels above) are together, thus making a logical target area unavailable.
- P.A confirmation sell orders are visible below the minor resistance 1.36666 at 1.36625, this level has proved valid, but still needs to be confirmed due to a spike seen on Friday (circled) which may have consumed most of the sellers originally there. Do be on your guard with these sell orders; the higher-timeframes are indicating that higher prices may be seen this week.
Chart 1:
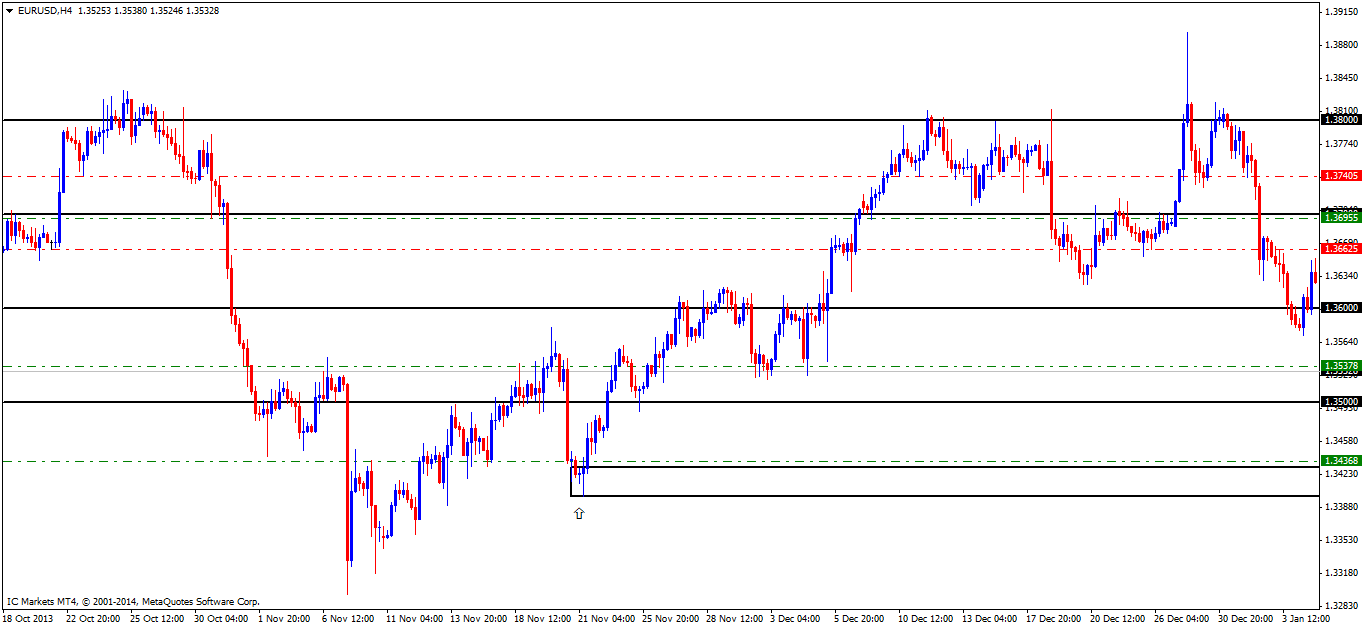
Chart 2:
- Areas to watch for buy orders: P.O: (Active) 1.35378 (SL: 1.34971 TP: [1] 1.36000 [2] 1.36666) 1.34368 (SL: 1.33926 TP: Dependent on how price action approaches the zone). P.A.C: No P.A confirmation buy orders are seen in the current market environment.
- Areas to watch for sell orders: P.O: 1.36955 (SL: 1.37270 TP: [1] 1.36666 [2] 1.36000) P.A.C: 1.37405 (SL: More than likely at 1.37791 TP: Dependent on where price ‘confirms’ the level) 1.36625 (SL: 1.36810 TP: Dependent on where price ‘confirms’ the level).
- Most likely scenario: The demand area at 1.35036-1.35312 will likely still see a bullish reaction, nevertheless, a spike lower may be seen first to the round number at 1.35000.
GBP/USD:
4hr TF.
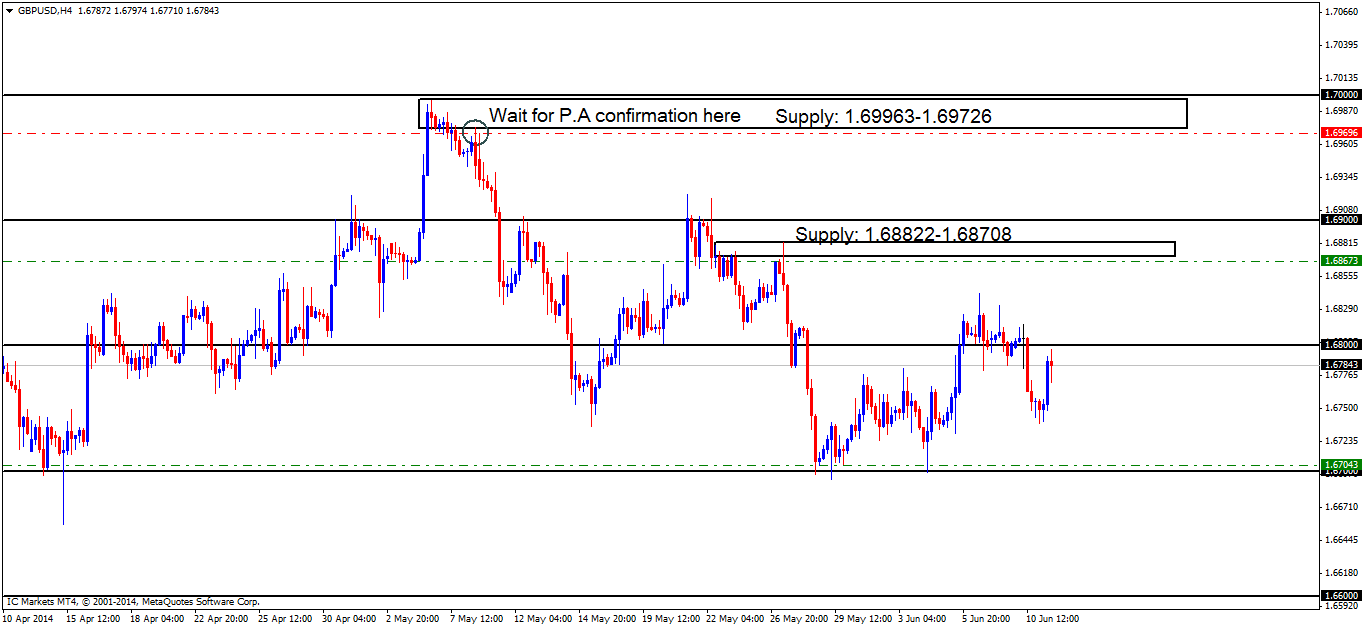
A sharp drop through the minor S/R flip level at 1.67686 has been seen, stopping out any buyers trying to trade long there as seen on chart 1.Price is now currently capped between supply at 1.68000 and demand below at 1.67000 as seen on chart 2
- Pending buy orders (Green line) are seen below (1.65874) just above demand at 1.65518-1.65827. This area shows great potential as the momentum away from the base indicates unfilled orders may still be in play.
- The next set of pending buy orders (Green line) are seen just above the round number 1.67000 at 1.67043, this area will likely see a reaction due to the amount of credible touches this level has seen, making it an area to watch out for.
- Small P.A confirmation buy orders (Red line) that were visible at 1.67727 just above the minor S/R flip level (1.67686) have now been cancelled. Price dropped too far from the entry level and was unable to consume the high 1.68419 marked with an x, deeming this level to be invalid.
- Pending sell orders (Green line) are visible below supply (1.68822-1.68708) at 1.68673 due to strong momentum away from this area, indicating unfilled orders may still be hiding there.
- P.A confirmation sell orders (Red line) are seen at 1.69696 just below supply at 1.69963-1.69726. The reason this level requires confirmation is due to the wicks spiking the area as price left the base (circled) warning us sellers may have already been consumed.
Chart 1:
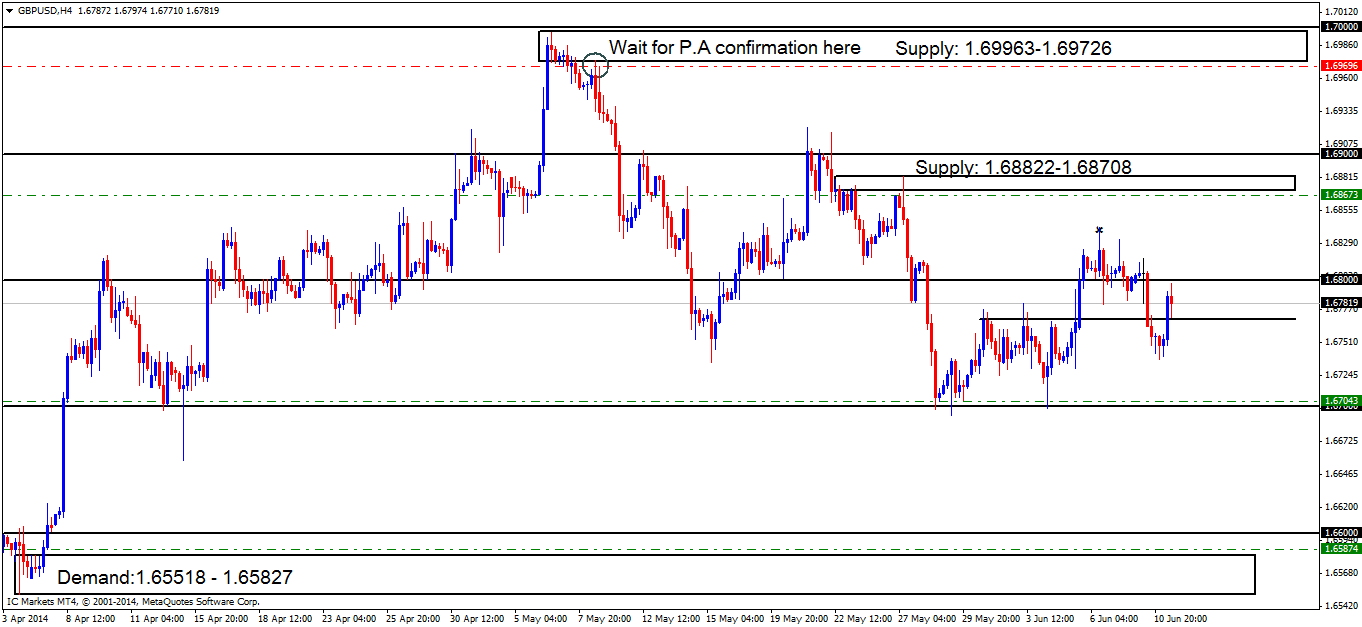
Chart 2:
- Areas to watch for buy orders: P.O: 1.65874 (SL: 1.65472 TP: Dependent on approaching price action nearer the time) 1.67043 (SL: 1.66527 TP: [1] 1.68000 [3] 1.68708). P.A.C: No P.A confirmation buy orders are seen in the current market environment.
- Areas to watch for sell orders: P.O: 1.68673 (SL: 1.68846 1 TP: 1.68000 but may be subject to change). P.A.C: 1.69696 (SL: More than likely will be at 1.70030 TP: Dependent on where price ‘confirms’ the level).
- Most likely scenario: This pair is becoming increasingly difficult to give an accurate analysis on. Price is currently seen trading between the round number 1.68000 above and the round number 1.67000 below. Depending on what develops in the next few trading sessions, price will likely test the round number 1.67000 before completely consuming sellers at the round number 1.68000.
AUD/USD:
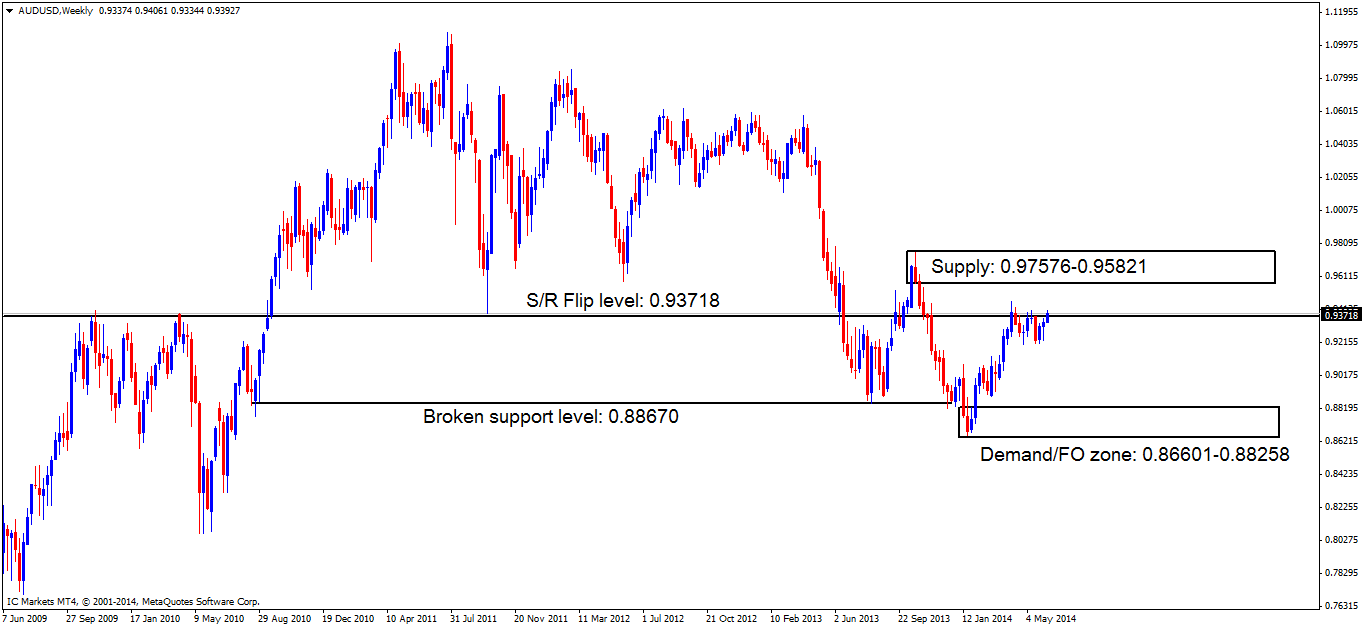
Weekly TF.
Price is currently seen trading at a long-term S/R flip level (0.93718).
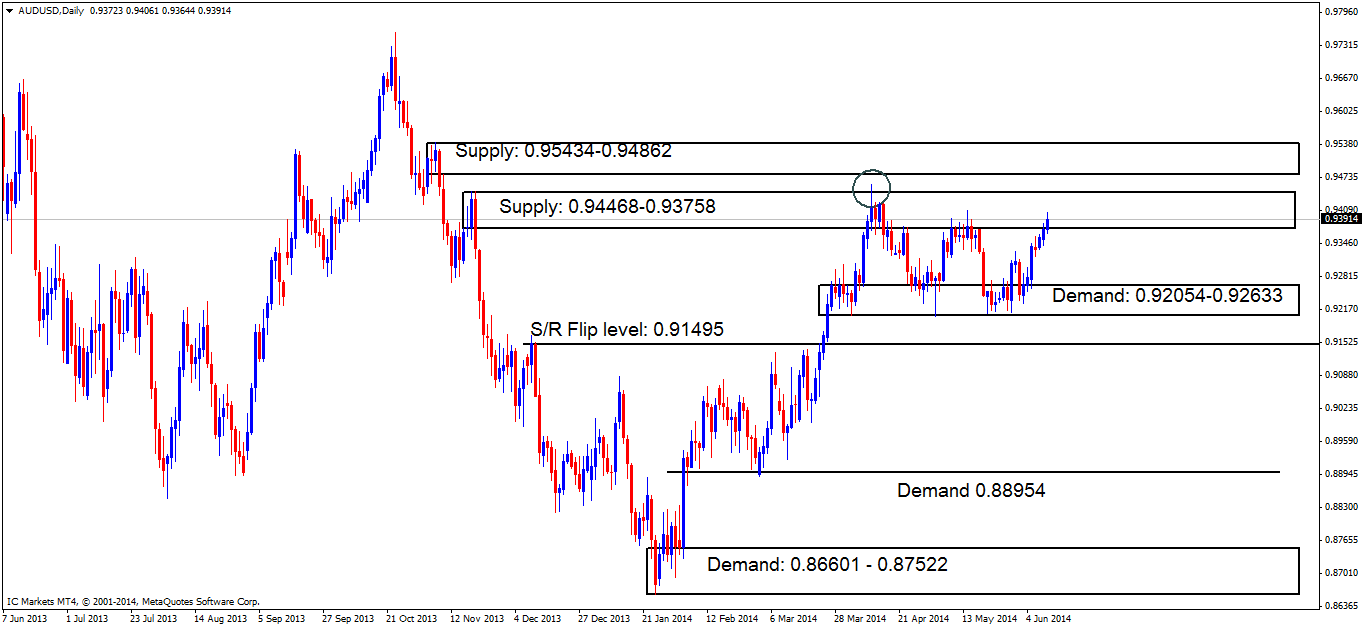
Daily TF.
The daily timeframe is currently trading within a weak-looking supply area at 0.94468-0.93758. The reason it may be weak is due to the circled area to the left containing a spike/wick that may have consumed sellers, thus weakening the selling pressure around this zone.
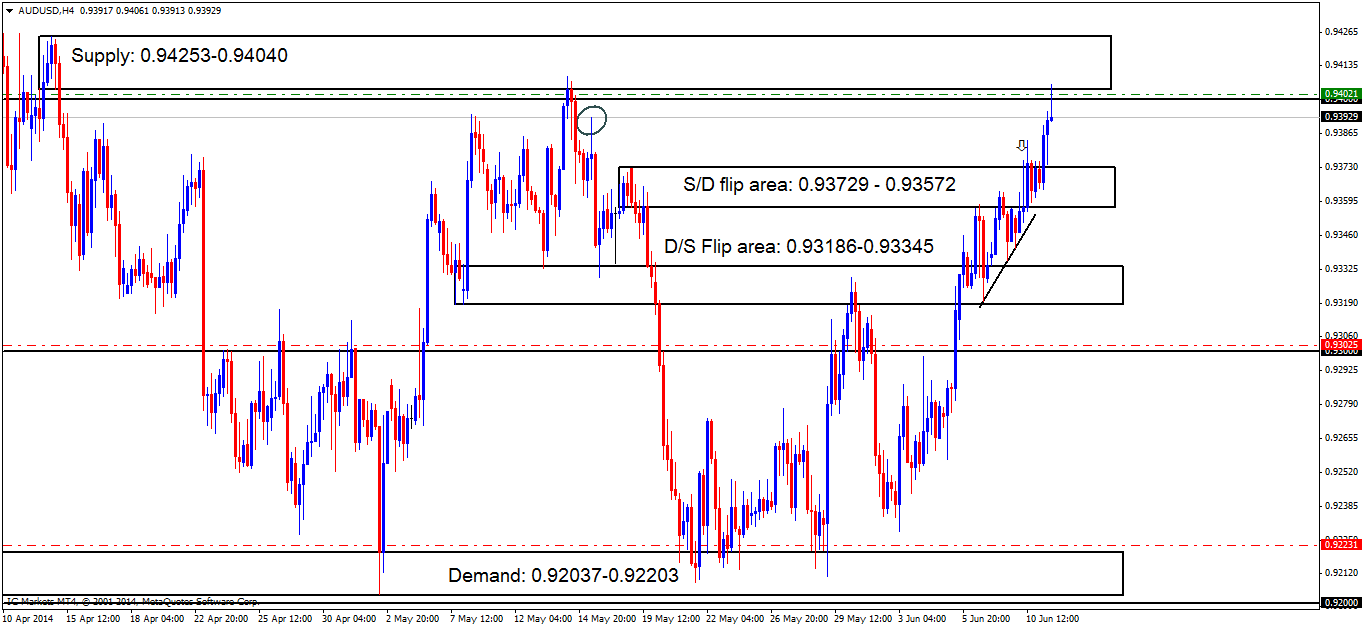
4hr TF.
Yesterday’s analysis saw conflicting signals:
‘Price action on this timeframe seems to have conflicting signals. The mini trend line shown on the 4hr chart below indicates that pro money are likely consuming lower timeframe demand pockets while still rallying price i.e. clearing the path south for their sell orders.
On the other hand, a wick/spike (marked with an arrow) has been seen above supply at 0.93729-0.93572 giving a signal that price may want to visit the upper supply at 0.94253-0.94040 since sellers in this area may have been consumed leaving the path clear for buyers.’
We know now that the wick/spike did in fact consume sellers, clearing the path up to supply at 0.94253-0.94040, where a bearish reaction is currently being seen.
- No pending buy orders are seen in the current market environment.
- P.A confirmation buy orders (Red line) are seen at 0.92231 just above demand at 0.92037-0.92203. It would be too risky to set a pending order around this area, since deep spikes into this demand zone have been seen (levels above) possibly consuming the majority of buyers in the process.
- The next set of P.A confirmation buy orders (Red line) are visible just above the round number 0.93000 at 0.93025. We require confirmation of this level because previous price action has warned us deep tests both north and south happen on a regular basis, hence the need to wait for confirmation rather than getting stopped out time after time through lack of patience.
- The pending sell order (Green line) set just below supply (0.94253-0.94040) at 0.94021 is now active so keep a close eye on the first target area (reported below).
- No P.A confirmation sell orders are seen in the current market environment.
- Areas to watch for buy orders: P.O: No pending orders are seen with current price action. P.A.C: 0.92231 (SL: more than likely will be at 0.91984 TP: Decided if/when price ‘confirms’ the level) 0.93025 (SL: Dependent on where price ‘confirms’ the level TP: Dependent on where price ‘confirms’ the level)
- Areas to watch for sell orders: P.O: (Active) 0.94021 (SL: 0.94277 TP: [1] 0.93729 [2] 0.93345 [3] 0.93000) P.A.C: No P.A confirmation sell orders seen in the current market environment.
- Most likely scenario: Price will likely see a drop from supply at 0.94253-0.94040 towards the S/D flip area at 0.93729-0.93572.
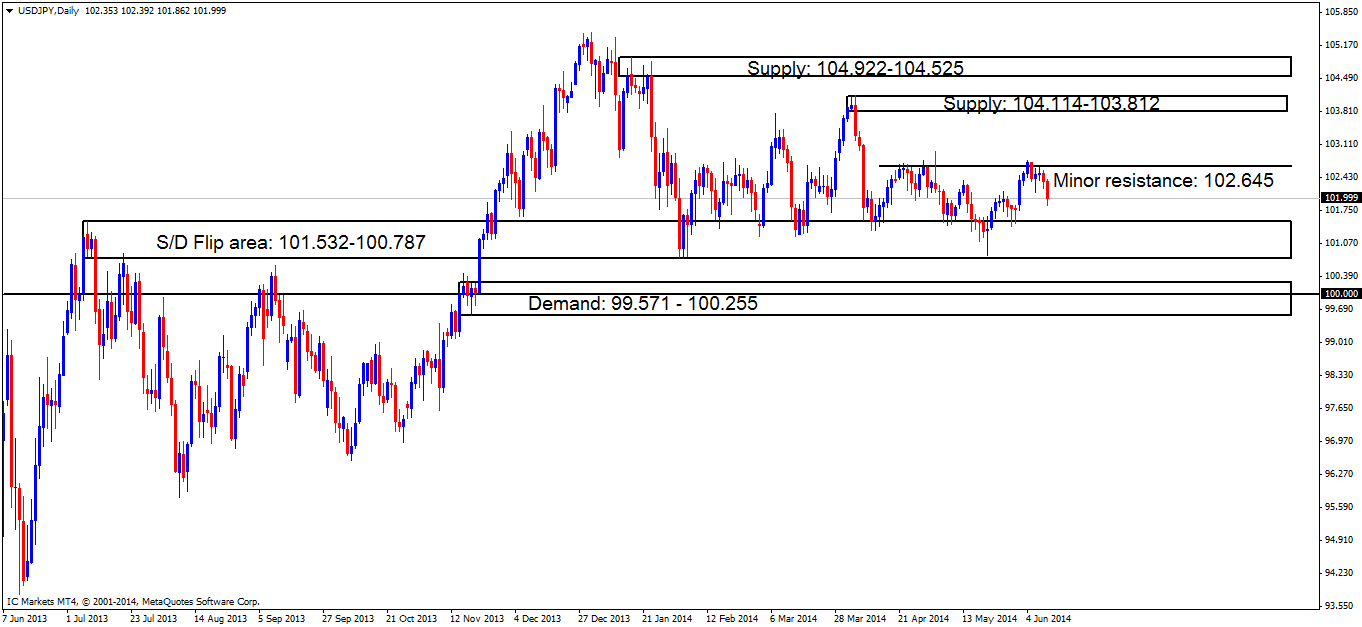
USD/JPY:
Daily TF.
Minor resistance at 102.645 is proving to be a valid area, as sellers are seen taking advantage of the available liquidity there.
4hr TF.
This is the reason we set confirmation orders on levels we are unsure of! The break of minor S/R flip level (102.117) was very likely the work of pro money (chart 1), not many retail traders have an account size to move the market like this.
With buyers at the minor S/R flip level (level above) consumed, a further push lower may be seen towards demand at 101.427-101.660 where we have a pending buy order set at 101.679.
- Pending buy orders (Green line) are seen just above demand (101.427-101.660) at 101.679, as this demand remains fresh and likely still holds unfilled orders.
- The P.A confirmation buy order (Red line) set at 102.141 has been cancelled. Price dropped too far from the entry level with one swift blow south, deeming this level to be invalid.
- Pending sell orders (Green line) are visible at 102.980, deep within supply (103.055-102.742), this area may well appear be weak now, but the way price reacted at the circled area indicates pro money activity, meaning sell orders may be left unfilled there, so a pending order is permitted.
- No P.A confirmation sell orders are seen in the current market environment.
Chart 1:
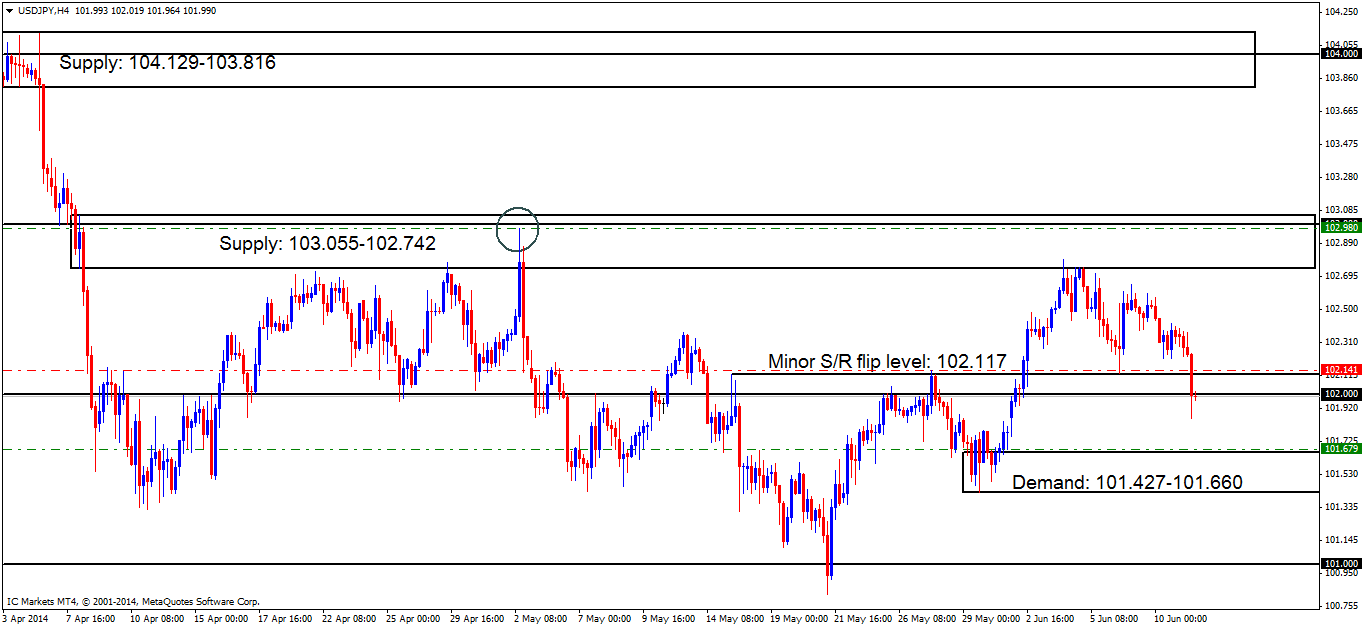
Chart 2:
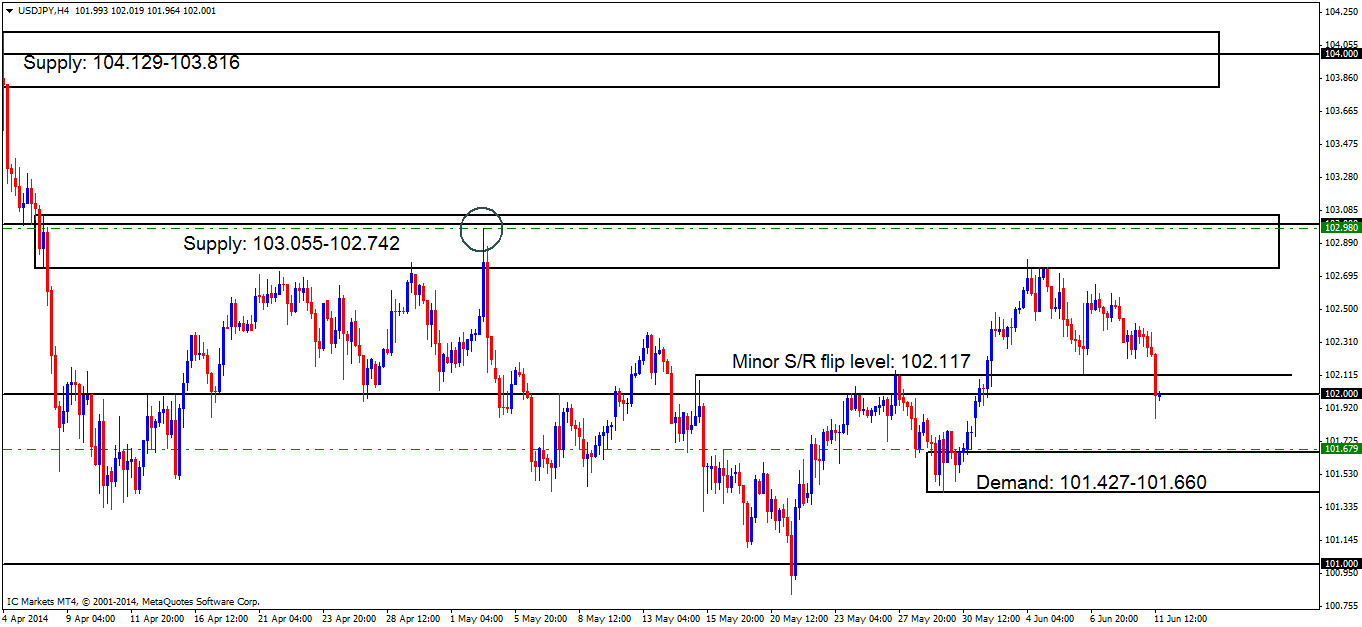
- Areas to watch for buy orders: P.O:101.679 (SL: 101.404 TP: [1] 102.000 [2] 102.742 but may be subject to change) P.A.C: No P.A confirmation buy orders seen in the current market environment.
- Areas to watch for sell orders: P.O: 102.980 (SL: 103.108 TP: 102.117, but may well change if the market sees any developments). P.A.C: No P.A confirmation sell orders seen in the current market environment.
- Most likely scenario: Price will likely see a decline in value towards demand at 101.427-101.660. However, before this drop in price is seen, a small rally is not out of the question up to at least the minor S/R flip level at 102.117.
EUR/GBP:
4hr TF.
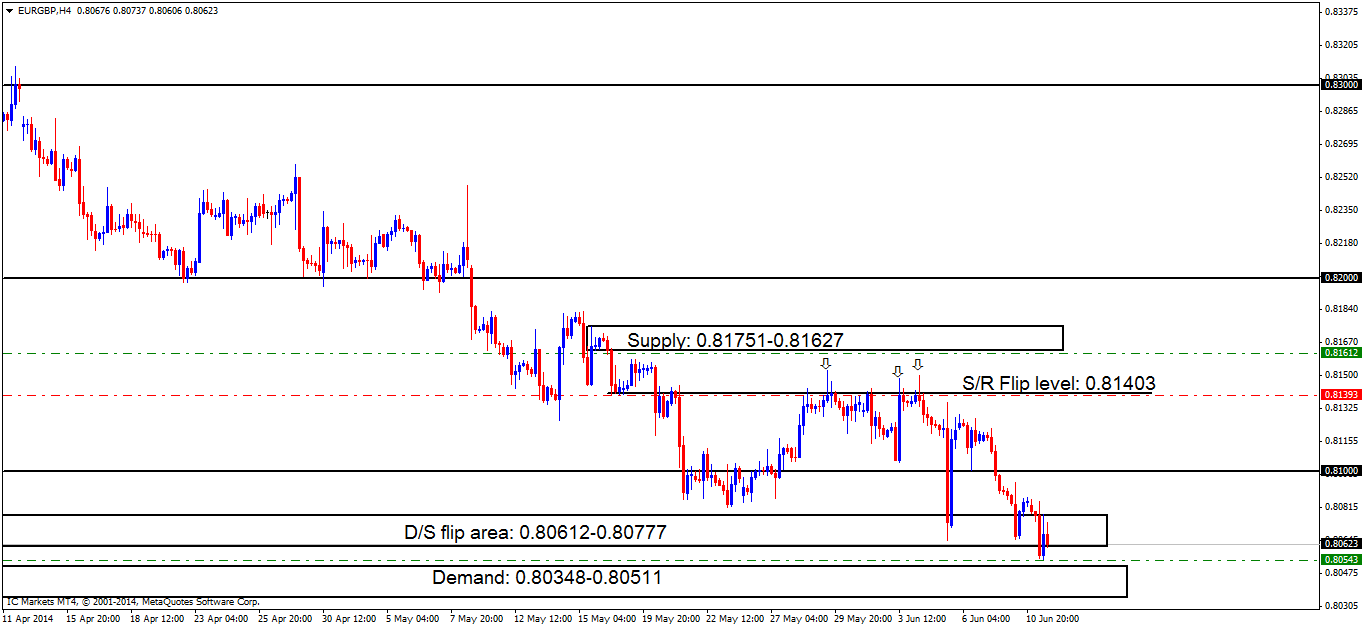
Price seems to have faked demand (0.80612-0.80777) into the demand area below at 0.80348-0.80511 as reported it may do in the last analysis (chart 1).
Buyers have shown a little interest here, but at the time of writing, they seem to be hitting quite strong resistance around the 0.80741 area. Price is now capped between demand at 0.80348-0.80511 and supply above at (D/S flip area) 0.80612-0.80777 (chart 2).
- The pending buy order (Green line) set at 0.80543 just above demand (0.80348-0.80511) would have recently been filled, if it was not for the spread on this pair.
- The P.A confirmation buy order (Red line) set at 0.80741 sitting within demand at 0.80612-0.80777 has now been cancelled, Price dropped too far from the entry level and was unable to consume sellers at the round number 0.81000 marked with an check sign (chart 1), deeming this level to be invalid.
- Pending sell orders (Green line) are spotted just under fresh supply (0.81751-0.81627) at 0.81612 due to the area being fresh giving the impression orders may still remain unfilled there.
- P.A confirmation sell orders (Red line) under the S/R flip level 0.81403 at 081393 is an area where a reaction is likely, however there were too many wicks north seen marked with arrows, indicating sellers are drying up, thus, the need to wait for more confirmation.
Chart 1
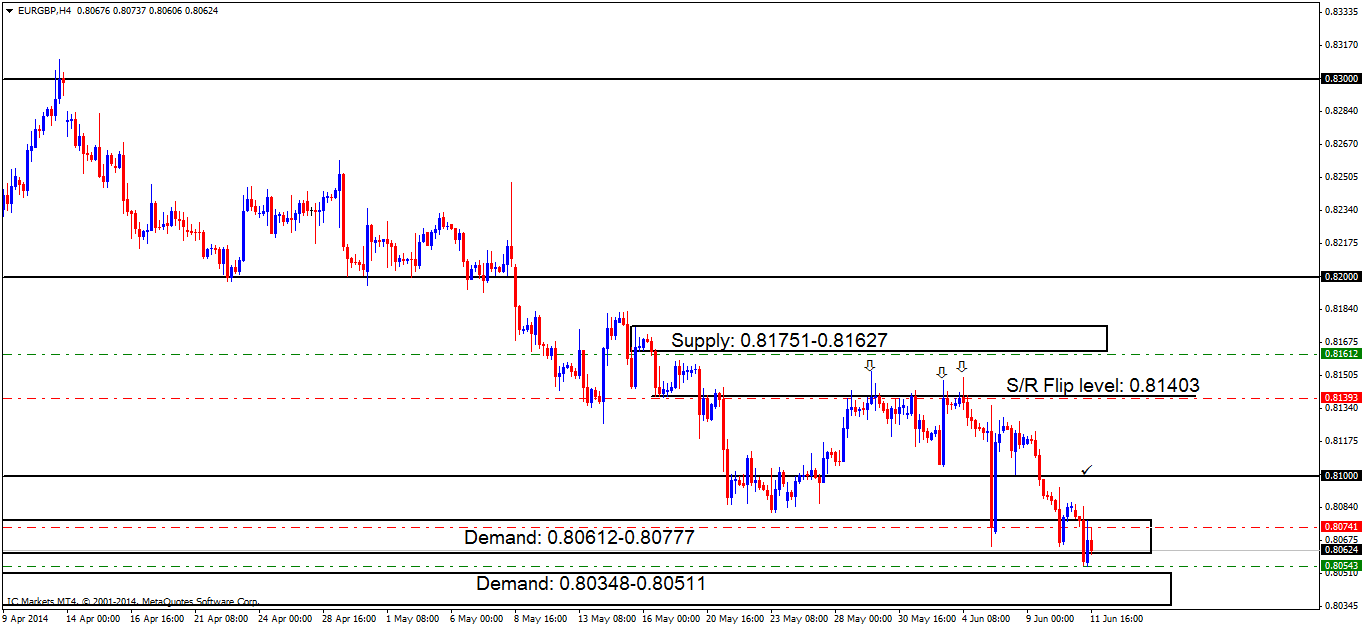
Chart 2:
- Areas to watch for buy orders: P.O:0.80543 (SL: 0.80328 TP: [1] 0.81000 [2] 0.81403) P.A.C: No P.A confirmation buy orders seen in the current market environment.
- Areas to watch for sell orders: P.O: 0.81612 (SL: 0.81784 TP: [1] 0.81403 [2] 0.81000) P.A.C: 0.81393 (SL: Will be likely set at 0.81564 TP: Will be likely set at the round number 0.81000).
- Most likely scenario: Price will likely trade within where price is currently capped (Supply: 0.80612-0.80777 Demand: 0.80348-0.80511) during the lower-volume sessions. Once volatility picks up, a rally higher may be seen towards the round number 0.81000.
USD/CAD:
Daily TF.
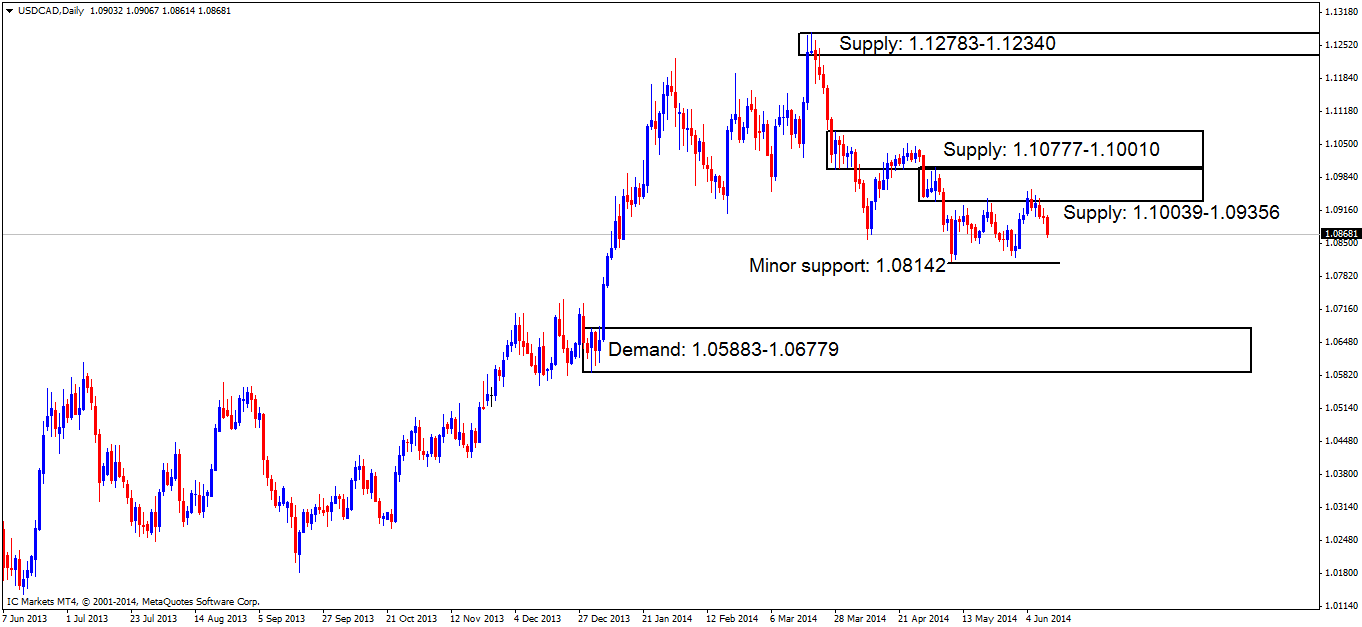
The daily timeframe still shows price capped between supply at 1.10039-1.09356 and demand below at 1.08142 with sellers seen taking full advantage of the available liquidity around supply.
4hr TF.
Price has well and truly consumed demand at 1.08907-1.09047, no doubt stopping out all buyers in and around this area along with cancelling out our P.A confirmation order at 1.09064 (chart 1).
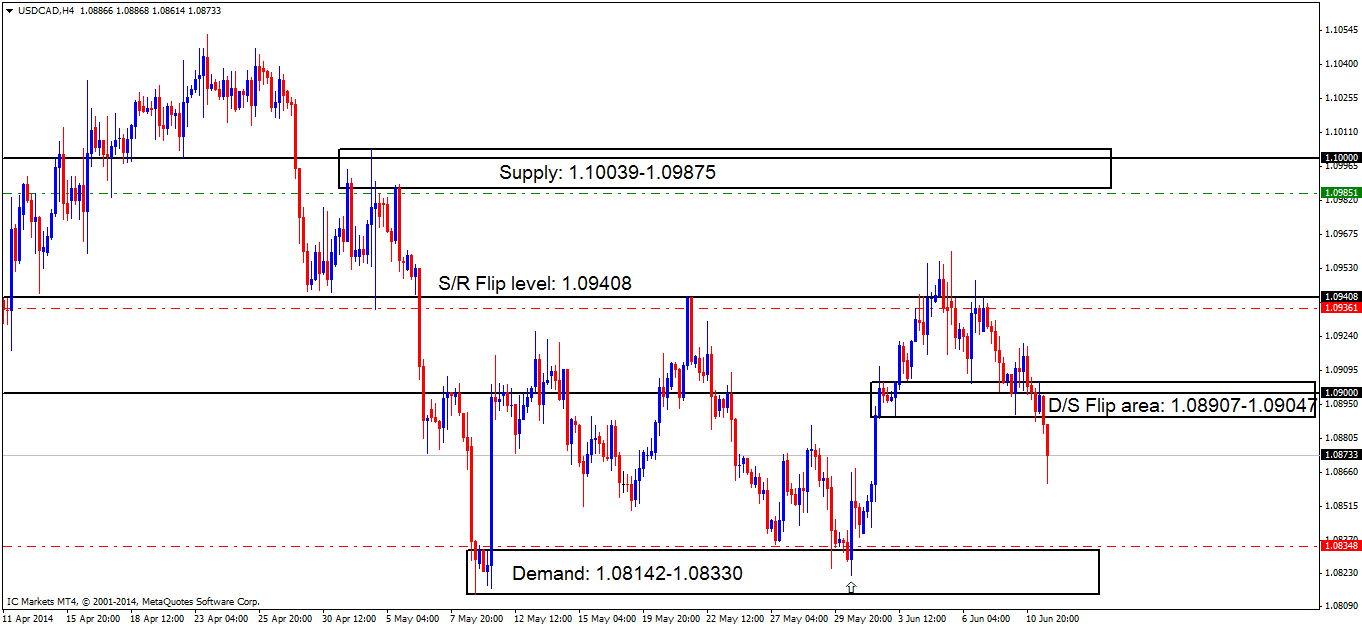
With a break seen of demand (levels above), the next area of interest is seen below at (demand) 1.08142-1.08330 which is currently capping price to the downside, with supply (D/S flip area) at 1.08907-1.09047 capping price to the upside (chart 2).
- At the time of writing there are no pending buy orders seen.
- P.A confirmation buy orders (Red line) seen just above demand (1.08142-1.08330) at 1.08348. There may be orders left unfilled here, however, a pending order is not wise due to how deep price penetrated the level before (marked with an arrow).
- The near-term P.A confirmation buy order at 1.09064 just above demand at 1.08907-1.09047 has been cancelled. Price dropped too far from the entry level, and was unable to consume sellers at the high 1.09480 marked with an arrow (chart 1), deeming this level to be invalid.
- Pending sell orders (Green line) just below supply (1.10039-1.09875) at 1.09851 will very likely see a nice reaction. However, we should remain aware of the big figure number 1.10000 lurking within the top half of the supply area (levels above), so a bigger stop may be necessary!
- New P.A confirmation sell orders (chart 2) are seen just below the S/R flip level (1.09408) at 1.09361. A P.A.C order was selected here because of the deep wicks seen in and around this area, possibly indicating sellers have been consumed, thus weakening the level on return.
Chart 1:
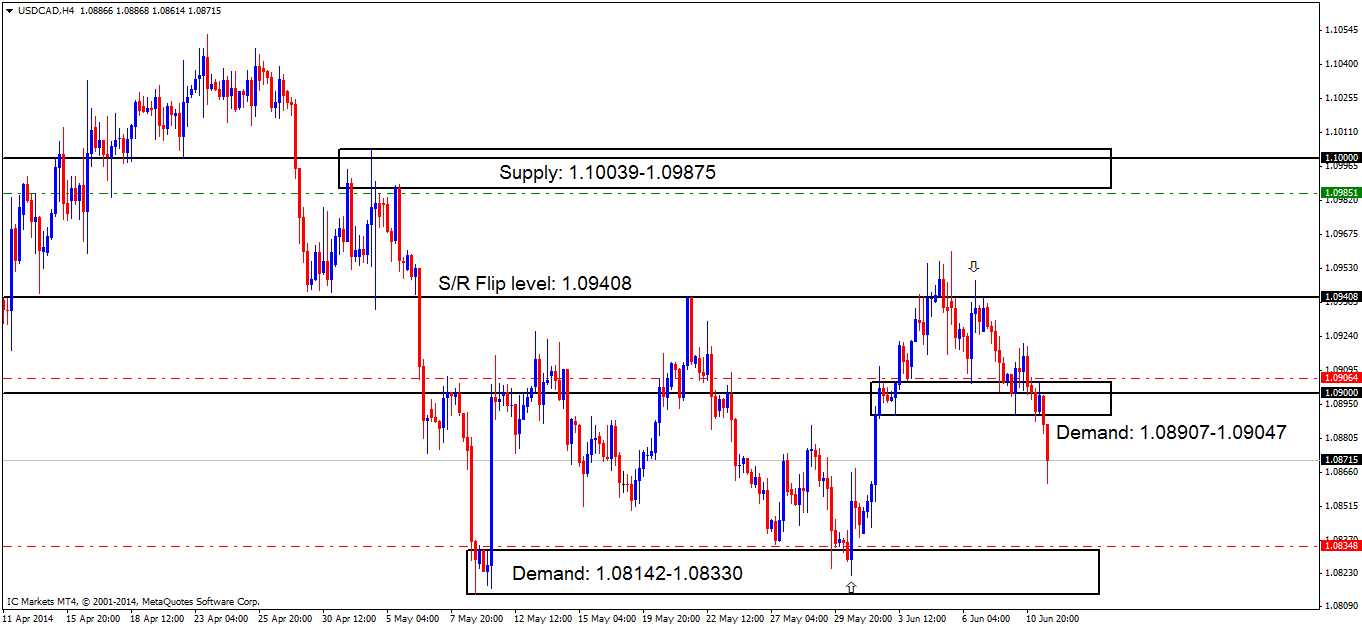
Chart 2:
- Areas to watch for buy orders: P.O: There are no pending buy orders seen in the current market environment. P.A.C: 1.08348 (SL: Likely to be set at 1.08127 TP: Decided if/when price ‘confirms’ the level).
- Areas to watch for sell orders: P.O: 1.09851 (SL: 1.10114 TP: [1] 1.09408 [2] 1.09047) P.A.C: 1.09361 (SL likely to be set at 1.09513 TP Decided if/when price ‘confirms’ the level).
- Most likely scenario: Price will likely continue declining until the buyers outweigh the sellers which will likely be around the demand area at 1.08142-1.08330. Do not expect price to keep dropping in a straight line, there will be small retracements in between no doubt from traders locking in profits.
USD/CHF:
4hr TF.
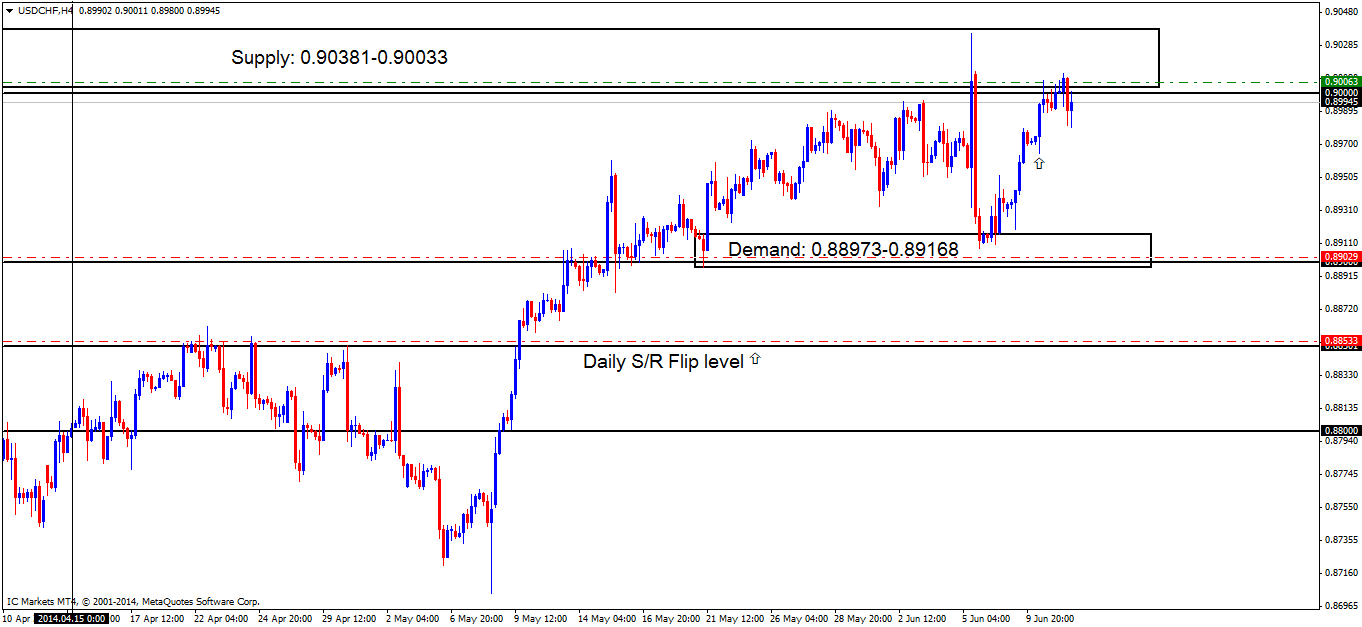
At the time of writing, price still remains capped between supply at 0.90381-0.90033 and demand below at 0.88973-0.89168.
Sellers are beginning to show some sign of life around supply at 0.90381-0.90033. The area marked with an arrow just below at 0.89747 is proving to be a difficult level for the sellers to break with two tails currently seen rejecting price from this area. For this trade to work out and to hit at least the first target, we will need to see price consume this small demand level with conviction.
- There are no safe pending buy orders seen at the time of writing.
- P.A confirmation buy orders (Red line) are seen just above the daily S/R flip level (0.88501) at 0.88533. This level needs to see some confirming price action before any entry is placed in the market, due to their being no logical area for a stop loss order.
- Near-term P.A confirmation buy orders are seen within demand (0.88973-0.89168) at 0.89029, just above the round number 0.89000, as price may retrace to demand to collect unfilled orders.
- The pending sell order (Green line) visible at the base of supply (0.90381-0.90033) just above the round number 0.90000 at 0.90063 still remains active, so keep a close eye on the first target area.
- No P.A confirmation sell orders are seen in the current market environment.
- Areas to watch for buy orders: P.O: There are no pending buy orders seen in the current market environment. P.A.C: 0.88533 (SL: Decided if/when price ‘confirms’ the level TP: Decided if/when price ‘confirms’ the level) 0.89029 (SL: Likely to be set at 0.88784 TP: Decided if/when price ‘confirms’ the level).
- Areas to watch for sell orders: P.O: (Active) 0.90063 (SL: 0.90412 TP: [1] 0.89168 [2] 0.88501) P.A.C: There are currently no P.A confirmation orders seen in the current market environment.
- Most likely scenario: Sellers will likely attempt to consume the small demand area seen at 0.89747, if this happens there is very little stopping price from dropping to demand at 0.88973-0.89168.
XAU/USD (GOLD):
4hr TF.
Gold is seen still trading within supply at 1268.03-1260.87, with not much developments being seen since the last analysis. Our P.A confirmation sell order is still active at 1260.24
Price is currently capped between the supply area mentioned above, and minor support below at 1240.66.
- Pending buy orders (Green line) are seen above demand (1231.56-1237.57) at 1238.61 as pro money will likely fake the minor support level at 1240.66 into demand below (levels above).
- No P.A confirmation buy orders are seen in the current market environment.
- Pending sell orders (Green line) are seen just below supply (1293.47-1285.52) at 1284.53, as this level will likely see a reaction due to a supply/demand imbalance around this area indicating the possibility of unfilled sell orders there
- P.A confirmation sell orders just under the S/R flip area (1273.34) at 1272.96 will likely see a reaction; be that as it may, there is still no logical area for a stop, resulting in confirmation being required.
- The P.A confirmation sell order (Red line) set just below supply (1268.03-1260.87) at 1260.24 still remains active. Sellers will need to confirm this supply area by consuming the low 1250.17 marked with an arrow. If/when this happens; a pending order can be set at 1260.24, awaiting a possible return to this area.
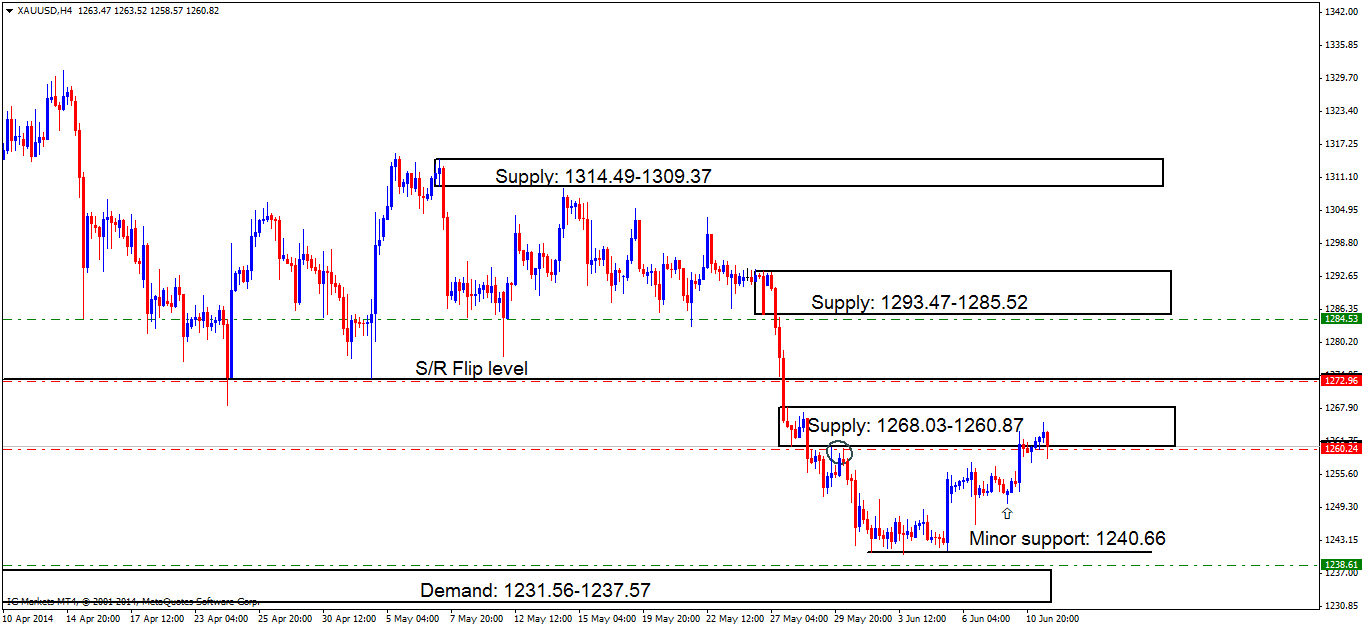
- Areas to watch for buy orders: P.O: 1238.61 (SL: 1230.64 TP: 1260.87 P.A.C: There are currently no P.A confirmation buy orders seen in the current market environment.
- Areas to watch for sell orders: P.O: 1284.53 (SL: 1294.70 TP: [1] 1273.34 [2] 1268.03) P.A.C: 1272.96 (SL: Decided if/when price ‘confirms’ the level TP: Decided if/when price ‘confirms’ the level) 1260.24 (Active-awaiting confirmation) (SL: Will be likely set at 1269.04 TP: Decided if/when price ‘confirms’ the level).
- Most likely scenario: Seeing selling pressure around supply at 1268.03-1260.87 is unlikely since the higher timeframes are currently indicating longs as the daily timeframe is currently seen trading within demand at 1238.51-1254.97, hence the need for confirmation orders.


