Previous Story
Monday 11th May: Weekly technical outlook and review.

EUR/USD:
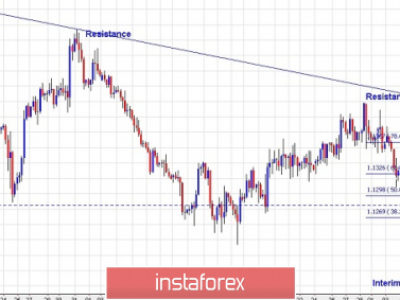
Weekly view: The weekly timeframe shows that equal buying and selling pressure was seen last week from both the weekly supply zone coming in at 1.1449-1.1278, and a weekly swap level seen at 1.1051. This consequently forced the market to print a clear weekly indecision candle. The past two months have been the most we’ve seen the Euro pair rally since price began its descent back in May 2014. In spite of this, our long-term bias still remains south and will continue to do so until we see a convincing push above the aforementioned weekly supply area.
Daily view: The daily timeframe shows that the rebound seen from the Harmonic Bat reversal zone (1.1516/1.1376) on Thursday extended lower during Friday’s session, forcing the market to close the week at 1.1208. As far as we can see, further selling could potentially take place from here this week, as price may want to retest the daily swap area again seen at 1.1051-1.0918 (located just below the weekly swap level 1.1051). This, in our opinion, would be a good place for any traders who took short positions at the Harmonic reversal zone to maybe lock in some profits and move stops to breakeven, as it lines up beautifully with the 0.382 retracement of A-D.
4hr view: The 4hr timeframe shows that price reacted sluggishly to NFP data. Intraday resistance at 1.1265 held firm throughout both the London and New York’s session, while 1.1200 was violated multiple times driving price into the small 4hr demand area seen just below it at 1.1175-1.1187.
With everything taken into consideration, where do we see the Euro moving to this week? Well, longer term it’s very difficult to tell until either weekly supply or the weekly swap level is engulfed (see above). Today, and possibly into tomorrow, nevertheless, will likely see the bulls and bears go toe-to-toe between 4hr demand 1.1175-1.1187 and 1.1265 resistance. Intraday buying and selling opportunities may exist within this 70-pip range; nonetheless traders should remain vigilant to the fact that fakeouts will very likely occur at these extremes. As such, we would recommend waiting for some sort of lower timeframe confirming signal before risking capital to this idea.
In the case that the 4hr demand area at 1.1175-1.1187 is consumed, the river south should be ‘ripple free’ so to speak down to at least the round number/weekly swap buy area at 1.1100/1.1051. Despite this, for us to be given the ‘green light’ to short following a close lower, we would need to see not only a strong retest of this 4hr demand as supply, but also supporting lower timeframe strength i.e. a trendline break, engulf of demand etc…
On the flip side, if the 1.1265 4hr resistance is violated this week, breakout buyers may want to hold fire since you’ll be buying into potential round number resistance 1.1300, which does not leave much room for price to breathe. Selling from 1.1300 would also not be something we’d take lightly since 1.1265 could potentially be supportive enough to throw us into drawdown.
Levels to watch/live orders:
- Buys: 1.1175-1.1187 [Tentative – confirmation required] (Predicative stop-loss orders seen at: 1.1165).
- Sells: 1.1265 [Tentative – confirmation required] (Predicative stop-loss orders seen at: dependent on where one confirms this level).
GBP/USD:
Weekly view: Last week’s candle closed (1.5436) strongly within weekly supply coming in at 1.5551-1.5391. Should a break above this area be seen this week, we could potentially see prices shake hands with yet another weekly supply zone coming in at 1.5784-1.5620.
Daily view: The daily picture shows that price ended the week rebounding from a daily Quasimodo resistance level at 1.5478, which, as you can probably see, is located nicely within the weekly supply area mentioned above at 1.5551-1.5391. In the event that we see a push above this daily level today or during the week, further upside could be seen towards the daily swap zone at 1.5619-1.5567 (positioned just below the weekly supply area mentioned above at 1.5784-1.5620).
4hr view: Fundamentally, the UK’s election result on Friday saw the Conservative party take an unexpected victory. This likely removed a huge amount of political uncertainty in the country. As a consequence, this saw the GBP/USD pair rally higher, taking out several technical levels in the process. The 1.5500 number, an area we mentioned to watch in the previous analysis, held firm against this buying onslaught which forced Sterling south to aggressively retest 1.5400 into the close.
From a technical standpoint, the Weekly and Daily timeframes are both suggesting short positions should be considered this week (see above). However, there is not a chance that we’re going to be selling this market today until we see a clear close below the 1.5400 level.
In the event that 1.5400 continues to hold firm, however, this could be a sign that the bears are weakening within higher-timeframe supply (see above). But as things stand, we would only consider buying this market if price manages to close above 1.5500, since there will then be a clear 60-pip profit gap from this number to the daily swap zone mentioned above at 1.5619-1.5567.
Levels to watch/ live orders:
- Buys: Flat (Predicative stop-loss orders seen at: N/A).
- Sells: Flat (Predicative stop-loss orders seen at: N/A).
AUD/USD:
Weekly view: Last week’s action shows that price managed to close the week (0.7927) above a minor weekly swap level positioned at 0.7845, potentially indicating bullish strength from the weekly demand zone coming in at 0.7449-0.7678.
Daily view: The daily picture on the other hand, reveals that price is currently capped between a daily supply area seen at 0.8074-0.8006 (located just below the weekly swap level 0.8064), and a daily demand zone coming in at 0.7785-0.7850 (positioned just below the weekly swap level 0.7845).
4hr view: In the overall scheme of things, Friday’s trading sessions were not really anything to get excited about. A mediocre rally was seen from the psychological limit 0.7900, with price slightly rebounding from the mid-level number 0.7950 into the close.
Thanks to the reaction at 0.7950, we now have a potential 4hr Harmonic bullish Gartley pattern forming. Assuming that price continues to decline from 0.7950 this week, which we think it will (we’ll explain why in a moment), price will likely hit the 4hr Gartley reversal zone shaded in yellow coming in at 0.7832/0.7801. What is more, this 4hr reversal zone is also sitting within a clear 4hr demand area coming in at 0.7785-0.7835 (located within the aforementioned daily demand area), which also boasts additional round-number support seen at 0.7800 – Not a bad place to be looking for longs!
Why do we think prices will decline in value this week? Well, assuming price manages to consume the round number 0.7900, the pathway south is likely ‘demand free’ so to speak. Our rationale behind this idea comes from the demand consumption tails seen marked with a small red line at: 0.7862/0.7874/0.7883. These tails were likely sent south fill unfilled buy orders around the 0.7900 area in order to continue rallying higher, thus with little buyers left here, price should theoretically be free to drop.

Levels to watch/ live orders:
- Buys: 0.7832/0.7801 [Tentative – confirmation required] (Predicative stop-loss orders seen at: 0.7780).
- Sells: Flat (Predicative stop-loss orders seen at: N/A).
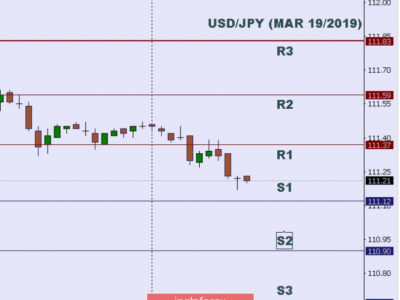
USD/JPY:
Weekly view: For nearly two months the weekly timeframe has shown very little change, as the buyers and sellers continue to battle for position within the weekly demand area coming in at 118.22-119.40. Our long-term bias will remain north on this pair as long as price continues to trade above the weekly swap level seen below this area at 115.50.
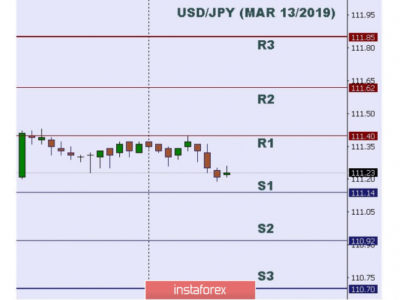
Daily view: From the daily scale, we can see that a clear consolidation zone has been chiseled out within the aforementioned weekly demand area between daily support seen at 118.62 (located deep within the aforementioned weekly demand area), and a daily Quasimodo resistance level coming in at 120.35. The weekly close 119.76 has placed price in the middle of this range, so trading either long or short at this point would be low probability in our opinion. It will be interesting to see what the 4hr timeframe has to offer…
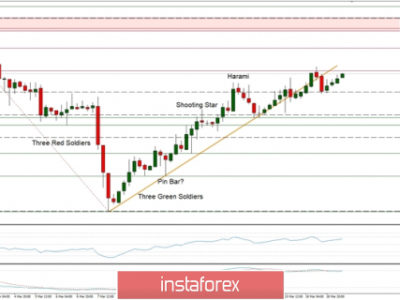
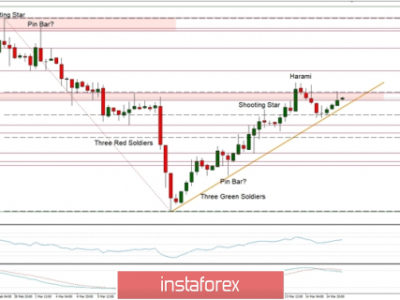
4hr view: Friday’s sessions saw the USD/JPY pair aggressively test the 120.00 handle, which, as we can all see, failed once price reached the 120.20 region. Thanks to the sharp descent seen from 120.20, we now have a potential 4hr Harmonic bullish Gartley pattern forming.
This Harmonic formation is currently in the process of completing its C-D leg down to the reversal zone shaded in yellow at 118.93/118.66, which comprises of the following numbers:
- 1.272 Fibonacci extension of AB.
- 0.786 Fibonacci retracement of XA.
- AB-CD pattern.
- Round-number support 119.00 seen just above this zone.
- Converging 4hr trendline from the low 115.84.
- Daily support (lower limit of daily range) coming in at 118.62. This is a very important aspect.
As far as we can see, the only thing standing in the way of price reaching this reversal zone is 119.50. Should we see a close below this number today, the path south should be clear down to at least 119.00, which is where we intend to being looking watching the lower timeframe price action for buying confirmation.
On the flip side, should the market decide it wants to go higher this week, we’ll be looking for 120.00 to be consumed, and price to touch base with the 4hr Quasimodo resistance line coming in at 120.27. This level, as you can probably see, is not only located very near to the upper limit of the daily consolidation area at 120.35 (see daily section), but also converges nicely with a 4hr down trendline extended from the high 120.83, making it an awesome place to look for confirmed shorting opportunities if prices should trade this high. Targets would need to be kept sensible here, however, since let’s not forget that price is still hovering within weekly demand (see above) at the moment.

Levels to watch/ live orders:
- Buys: 119.00/118.62 [Tentative – confirmation required] (Predicative stop-loss orders seen at: dependent on where one confirms this area).
- Sells: 120.27/120.35 [Tentative – confirmation required] (Predicative stop-loss orders seen at: dependent on where one confirms this area).
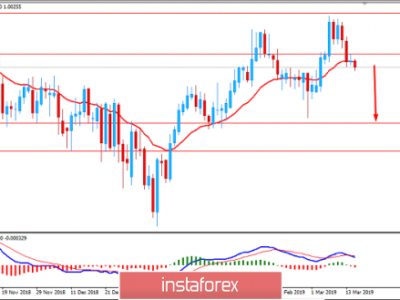
USD/CAD:
Weekly view: (Revised from last week’s edition) Last week’s candle shows that price once again rejected the weekly swap area coming in at 1.2034-1.1870. Although this time, as you can see, price closed lower than the previous weekly close (1.2156) at 1.2073, indicating that the bulls could be running out of steam here. Let’s see what we can find on the lower timeframes…
Daily view: From this angle, we can clearly see that buying interest exists within daily demand coming in at 1.1931-1.2045 (located within the aforementioned weekly swap area), which converges just beautifully with a Harmonic Bat support zone completing just below it at 1.1921. Even though this timeframe is showing relatively strong support here, it has still failed on two occasions to convincingly close above the mid-level number 1.1250.
4hr view: Friday’s trading action shows that price was capped between a 4hr downtrend line extended from the high 1.2304, and a small, yet clearly resilient 4hr demand area coming in at 1.2034-1.2048 (positioned just within the daily demand area at 1.1931-1.2045).
Due to the lack of enthusiasm being seen from the buyers on the higher timeframes (see above) at the moment, our team has come to a general consensus that buying this pair will be safer once a close above the aforementioned 4hr downtrend line is seen. This, however, does not mean we cannot look for small bounce trades off of either the 4hr demand area at 1.2034-1.2048 or the large psychological number 1.2000 today. Waiting for lower timeframe confirmation is strongly advised if you’re also considering long positions from either of the above 4hr levels.
Selling this pair on the other hand, is not something our guys would be comfortable taking part in until a convincing close is seen below the 4hr demand area at 1.1931-1.1960 (located deep within the aforementioned daily demand area).

Levels to watch/live orders:
- Buys: 1.2034-1.2048 [Tentative – confirmation required] (Predicative stop-loss orders seen at: 1.2025) 1.2000 [Tentative-confirmation required] (Predicative stop-loss orders seen at: dependent on where one confirms this level).
- Sells: Flat (Predicative stop-loss orders seen at: N/A).
USD/CHF:
Weekly view: Last week’s action shows that there was an aggressive break of the weekly demand area seen at 0.9170-0.9343, which as you can see, came very near to crossing swords with the weekly swap level 0.9018. From around the 0.9070 mark, we saw active buyers take over the market forcing price to close near its open (0.9331) at 0.9310. Assuming that the buyers can continue with this tempo this week, it’s likely we’ll see price hit the weekly swap level 0.9512.
Daily view: The deep spike seen below daily demand last week at 0.9155-0.9206 (located deep within the aforementioned weekly demand area) clearly attracted buyers into the market, as price surged higher on Friday, consequently closing a few pips below a fresh daily supply area seen at 0.9411-0.9336.
4hr view: Friday’s action shows that price beautifully retested the round number 0.9200 as support, and rallied higher. This move took out 4hr supply seen at 0.9279-0.9262, and closed for the week within 4hr supply coming in at 0.9331-0.9295.
Selling from this 4hr supply area sounds great considering it is located just below daily supply at 0.9411-0.9336, but with potential support looming just below this zone from the recently broken 4hr supply area 0.9279-0.9262 has ‘potential loss’ written all over it. Our team has agreed that we’ll not be shorting this market until we see a close below and confirmed lower timeframe retest of this 4hr swap zone.
In the event that a close above the current 4hr supply area is seen on the other hand, this would likely open the gates to further upside towards at least 0.9400. Buying on the break of this area is quite dangerous in our opinion as you’d have just successfully bought your way into daily supply at 0.9411-0.9336. A more conservative approach (in our opinion) would be to wait for prices to successfully retest this 4hr supply area as demand, and then await a lower timeframe signal to enter long. The lower timeframe signal would give you not only a better entry, but far better risk/reward on your trade. Should this trade opportunity come to fruition, we’d look to target 0.9400 but at the same time our team would be prepared to close our position early should active sellers appear to be entering the market.

Levels to watch/ live orders:
- Buys: Flat (Predicative stop-loss orders seen at: N/A).
- Sells: Flat (Predicative stop-loss orders seen at: N/A).
US 30:
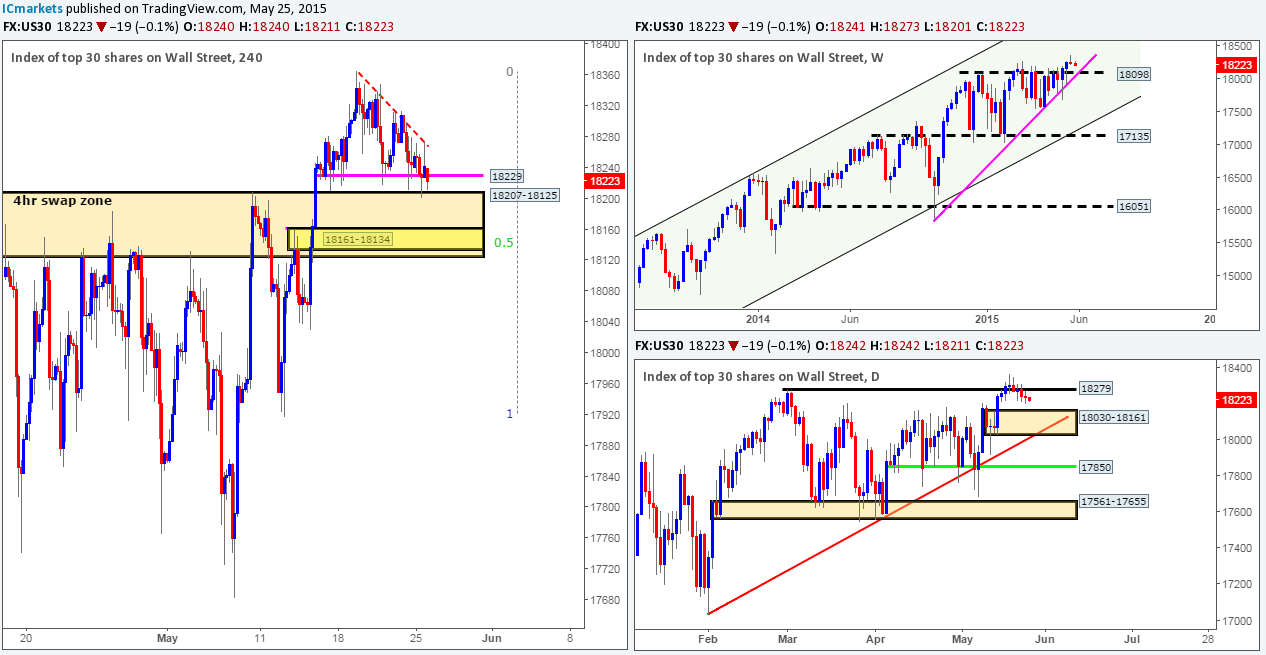
Weekly view: Last week’s action shows that price closed (18177) above the four-month long resistance barrier at 18098, which could imply higher prices may be seen this week. This move, however, at least from where we’re standing, does not mean we should all go hitting the buy buttons now. For us, the buyers will need to prove this break higher was genuine by maintaining a solid position above this number this week.
Daily view: From this angle, we can see that price is still range bound between daily support at 17850, and daily supply coming in at 18207-18117. However, the upper limits of this range were severely tested on Friday as the DOW rallied a cool 240 points, on (as far as we can see) the basis that 223,000 jobs were added in the US during April versus the 126,000 seen in March.
4hr view: The recent advance on the DOW took out the 18110 4hr resistance line along with its converging 4hr trendline 18279, and touched base with 4hr supply marked with a red circle at 18207-18164. This area has managed to hold the market lower on several occasions, and will probably do so again. Nevertheless, considering how deep price drove into this area this time, a ton of sell orders were likely consumed thus weakening the overall structure of this zone.
Taking all of the above into consideration, a drop in value will likely be seen today and possibly into tomorrow. This will likely be a combination of traders liquidating positions from the recent push north, and also the fact that we’re in 4hr and daily supply at present (see above). We have no interest in selling here, simply because price closed positively last week (see above). The area that we have our eye on at the moment is 18110. If price reaches this far south, and holds firm, we would consider buying from this zone (with lower timeframe confirmation), and target the 4hr supply area seen above at 18279-18250 (located above the daily supply area seen at 18207-18117) as per the black arrows, on the assumption that most of the supply has already been taken out within the aforementioned 4hr supply area.
Levels to watch/live orders:
- Buys: 18110 [Tentative – confirmation required] (Predicative stop-loss orders seen at: dependent on where one confirms this level).
- Sells: Flat (Predicative stop-loss orders seen at: N/A).
XAU/USD (Gold)
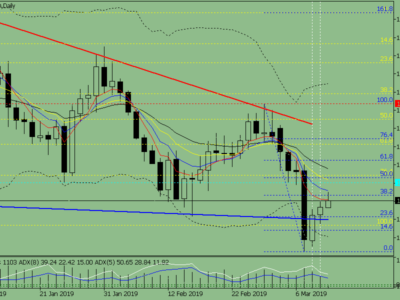
Weekly view: From a weekly standpoint, the trend on Gold is still firmly south, and will remain that way in our opinion until price closes above the weekly trendline extended from the high 1488.0. Last week’s trading action, however, shows very little movement was seen, as price appears to be stranded in between weekly supply seen at 1223.1-1202.6, and a weekly demand area coming in at 1130.1-1168.6.
Daily view: Last week’s daily action reveals that price once again tested daily support at 1178.3 on Thursday, which as you can see, saw very little follow-through buying interest on Friday. This support has held firm on four occasions now, yet each time, including the most recent, no higher high formed, which in itself could suggest buying weakness. A close below this daily barrier would not be the end of the world for the buyers mind you, since daily demand at 1159.4-1170.8 (located just within the aforementioned weekly demand area) is lurking just below to save the day.
4hr view: Take a quick look back at the AUD/USD and USD/JPY 4hr charts; the correlation to Gold’s recent price movement is near 100% at the moment! The only difference between these two pairs and Gold is there are two possible Gartley patterns forming on Gold at the moment, each with near-perfect symmetry. One has been colored in green – the bearish pattern, and the other in black – the bullish formation. The reversal zones which are shaded in yellow (bearish zone 1207.6/1201.7, bullish zone 1172.7/1176.5) both comprise of a clear and distinct 0.786 retracement of X-A, an AB=CD pattern and a 1.272 extension of A-B.
We’re sure most would agree, with the right confirmation signal seen within either of these 4hr Harmonic reversal zones, there is a very good chance a reversal will take place. However, which one do we think will see action first? Remember, there can only be one if we keep to the correct alignments of this pattern. Well, with the daily timeframe suggesting weakness is forming in the market at the moment (see above); we’re favoring a move lower to attack the bullish Gartley’s reversal zone first. In addition to this, we’re also seeing consumed demand just below the closing price 1188.4. Check out the clear demand consumption tails seen marked with a red trend line at 1184.2/1181.5. These tails were likely sent south to fill unfilled buy orders to continue rallying higher, thus with little buy orders left here, price should theoretically be free to drop down to test the 4hr demand area at 1177.6-1178.6. At this point, you may be thinking, but price has still not reached the Harmonic Gartley reversal zone. And you would be right; this is a potential obstacle, but not a strong one. See how price has already attacked this 4hr demand area once already on the 1st of May at 1170.3, this has very likely weakened the buyers here and considering the overall size of this area, we will likely see a fakeout next time it’s visited. A fakeout into where???? Right into our Harmonic reversal zone!

Levels to watch/live orders:
- Buys: 1172.7/1176.5 [Tentative – confirmation required] (Predicative stop-loss orders seen at: dependent on where one confirms this level).
- Sells: Flat (Predicative stop-loss orders seen at: N/A).
The post Monday 11th May: Weekly technical outlook and review. appeared first on .
Source:: Monday 11th May: Weekly technical outlook and review.