
Previous Story
Monday 14th July: Weekly Technical Outlook and Review.
Posted On 14 Jul 2014
Comment: 0
For the readers’ benefit:
Price action confirmation: simply means traders will likely wait for price action to confirm a level by consuming an opposing supply or demand area, then entering a trade on a possible retracement, this may occur on the lower timeframes also.
Pending orders: means pending orders are likely seen.
EUR/USD:
Weekly TF.
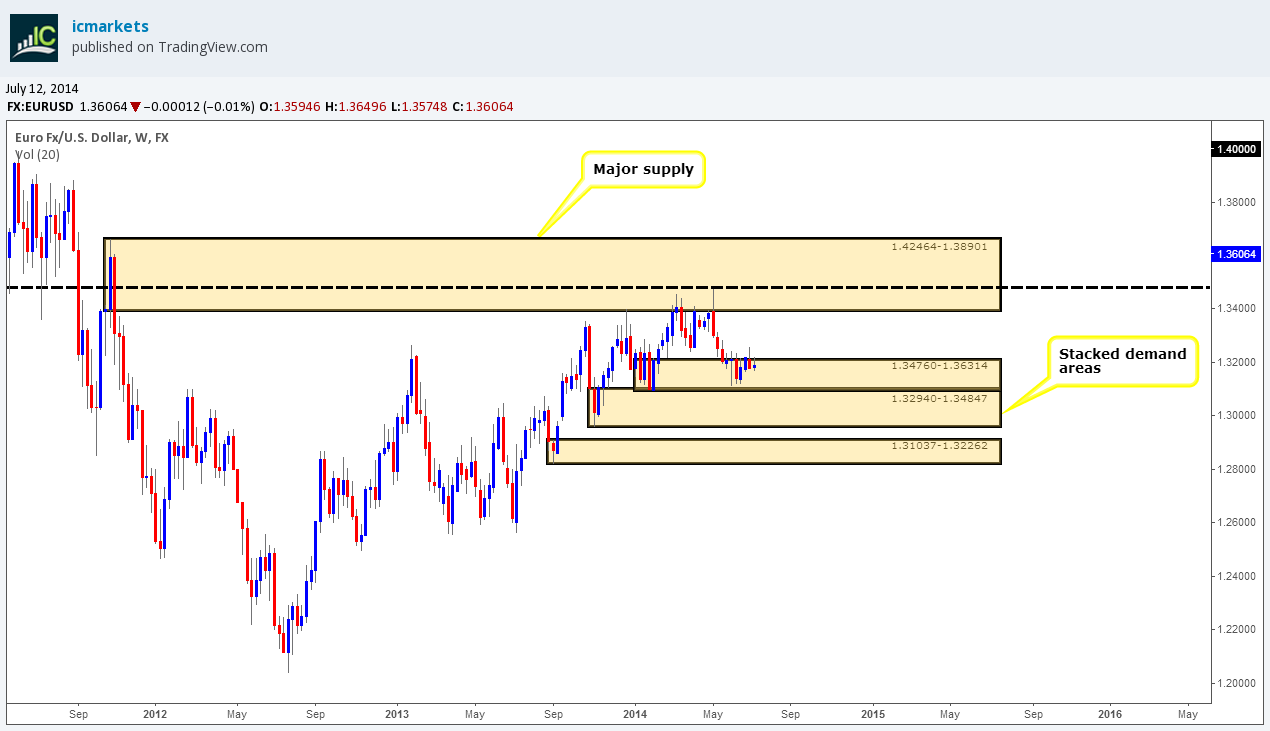
The weekly timeframe has not seen much change over the past six weeks as price is still trading within an important weekly demand area at 1.34760-1.36314. The sellers made an attempt at previous weekly lows (1.35844) but were rejected by the buyers which closed price for the week at 1.36064. Taking all of the above into consideration, higher prices are still expected this coming week.
Daily TF.
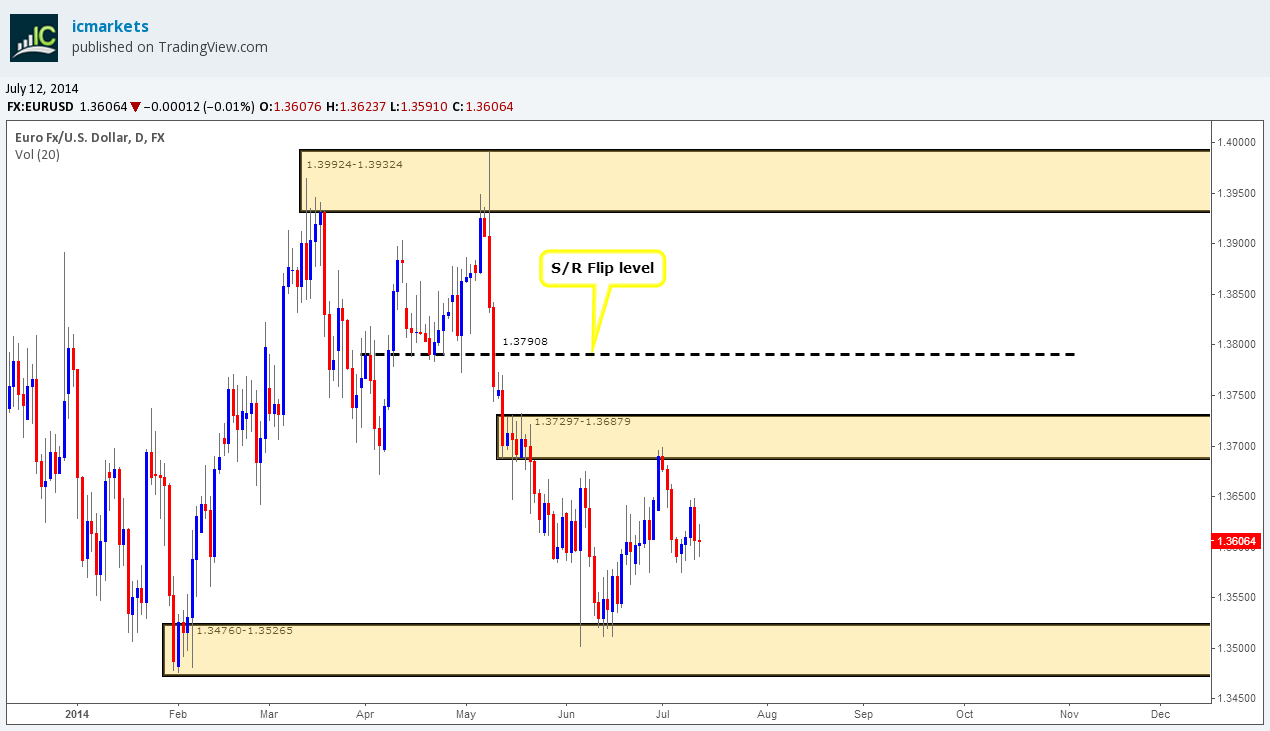
On the daily timeframe we see a closer view of the price action going on in the aforementioned weekly demand area (see above). Price is currently capped between daily supply at 1.37297-1.36879 and daily demand below at 1.34760-1.35265. Considering our location within the weekly timeframe, we are more than likely going to see a break of the aforementioned daily supply area before we do the daily demand area below.
4hr TF.
The round number 1.36000 did indeed see a test as reported may happen in the last analysis. Friday’s trading sessions remained mainly around this round number no doubt stopping both breakout traders, and possibly most of the traders attempting to buy there also causing a right mess!
The break of the low 1.36013 could be very important as this has opened up a zone likely free of demand/buyers. The red-dashed uptrend line likely resembles pro money consuming demand as they were pushing price higher, hence clearing the way for any possible selling activity down to at least the low 1.35746 which still remains important.
However, if pro money does indeed want to get price down to the low 1.35746, they will very likely need liquidity in the form of sell orders to buy into, where better than the recent decision-point supply area up at 1.36632-1.36485.
Pending/P.A confirmation orders:
- No pending buy orders (Green line) are seen in the current market environment.
- P.A confirmation buy orders (Red line) are seen just above demand (1.35018-1.35375) at 1.35417. The reason behind us placing a P.A confirmation buy order here, rather than a pending buy order is because the aforementioned demand area appears weak as deep spikes have been seen recently (marked with two arrows).
- New pending sell orders (Green line) are seen just below the decision-point supply area (1.36632-1.36485) at 1.36416. The reasoning behind placing a pending sell order here is due to the simple fact we have seen buyers consumed lower around the lows 1.36013, thus making it a low-risk high-probability trade.
- P.A confirmation sell orders (Red line) are seen just below supply (1.37224-1.37028) at 1.36894. A P.A.C order was selected here due to the reaction seen at the aforementioned supply area proving its validity. However, pro money may well decide to push price higher into this supply area if/when price returns to it, thus making it a risky trade for a stop above the high 1.36995 which could be very easily be stopped out if a pending sell order was set, hence the need to wait for confirmation.

Quick Recap:
The weekly timeframe still sees price dancing within weekly demand at 1.34760-1.36314; while on the daily timeframe we get a zoomed-in view of the weekly timeframe price action showing us price is capped between daily supply at 1.37297-1.36879, and daily demand below at 1.34760-1.35265. Buyers and sellers are currently seen battling it out around the round number 1.36000 on the 4hr timeframe, with the likely possibility of a move higher into 4hr supply at 1.36632-1.36485 before we see a touch of the low1.35746.
- Areas to watch for buy orders: P.O: No pending buy orders are seen in the current market environment. P.A.C: 1.35417 (SL: Dependent on price action after the level has been confirmed TP: Dependent on approaching price action after the level has been confirmed).
- Areas to watch for sell orders: P.O: 1.36416 (SL: 1.36584 TP: Dependent on price action approach).P.A.C: 1.36894 (SL: Dependent on price action after the level has been confirmed TP: Dependent on approaching price action after the level has been confirmed).
GBP/USD:
Weekly TF.
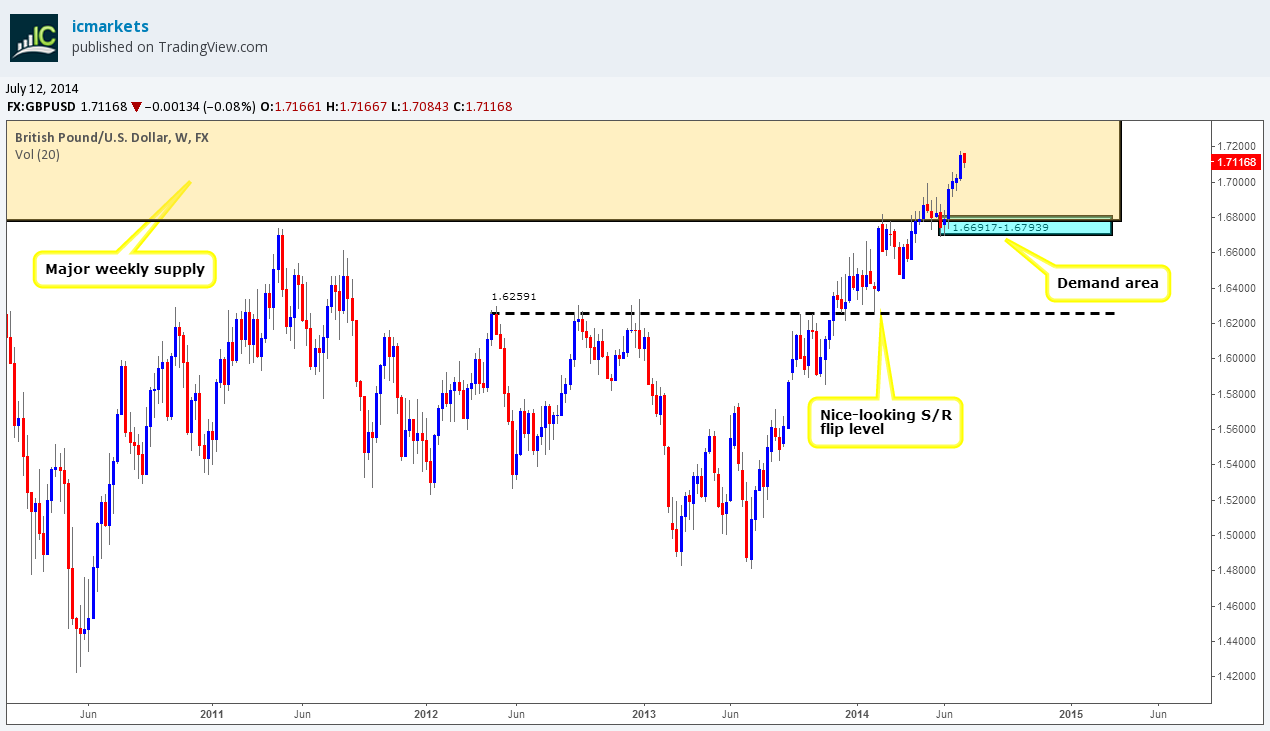
The weekly timeframe shows price is still trading deep within a major weekly supply area at 1.76297-1.67702. The sellers have begun to show a little interest, however nothing that should cause any excitement. At the time of writing the bulls are still well and truly in control, where could they be heading to? Let’s take a look on the lower timeframes.
Daily TF.
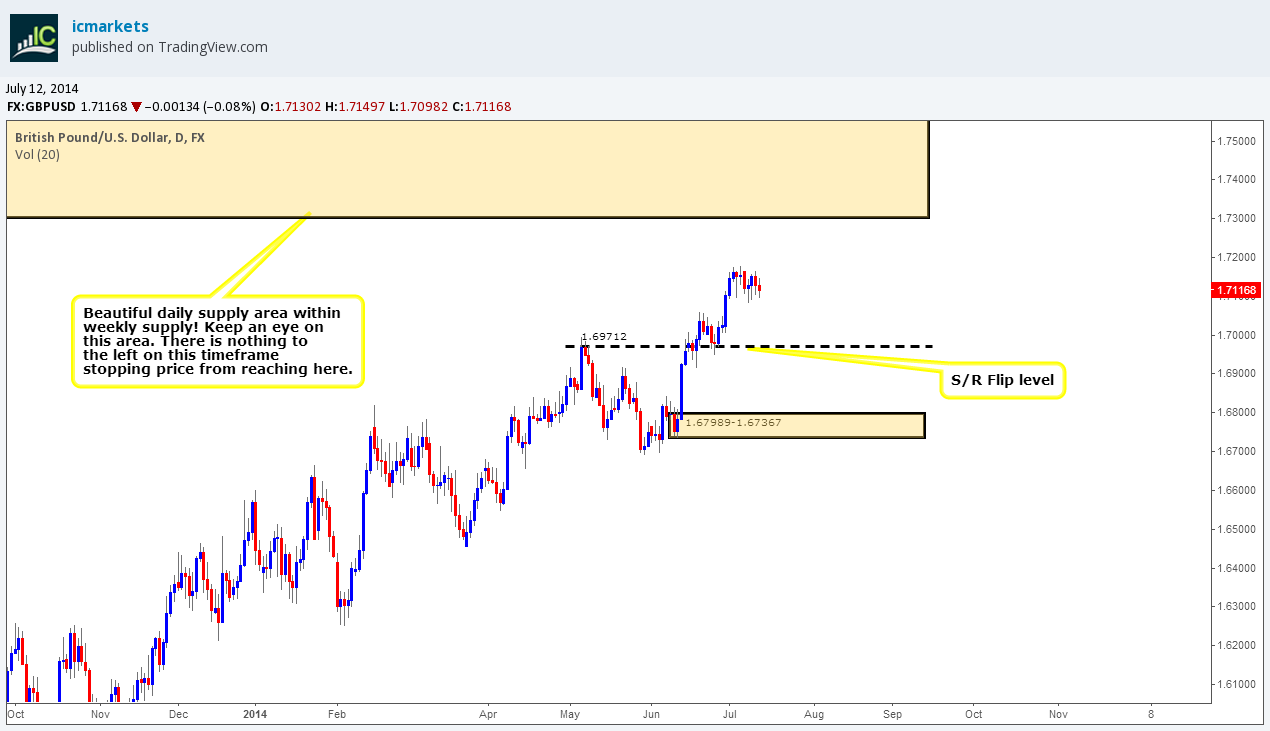
Here we can see the sellers’ interest in more detail, not exactly convincing right? A beautiful-looking daily supply area (1.76297-1.73024) is seen deep within the aforementioned weekly supply area, could this be where the buyers are heading to, as to the left there is very little in the way of supply stopping it?
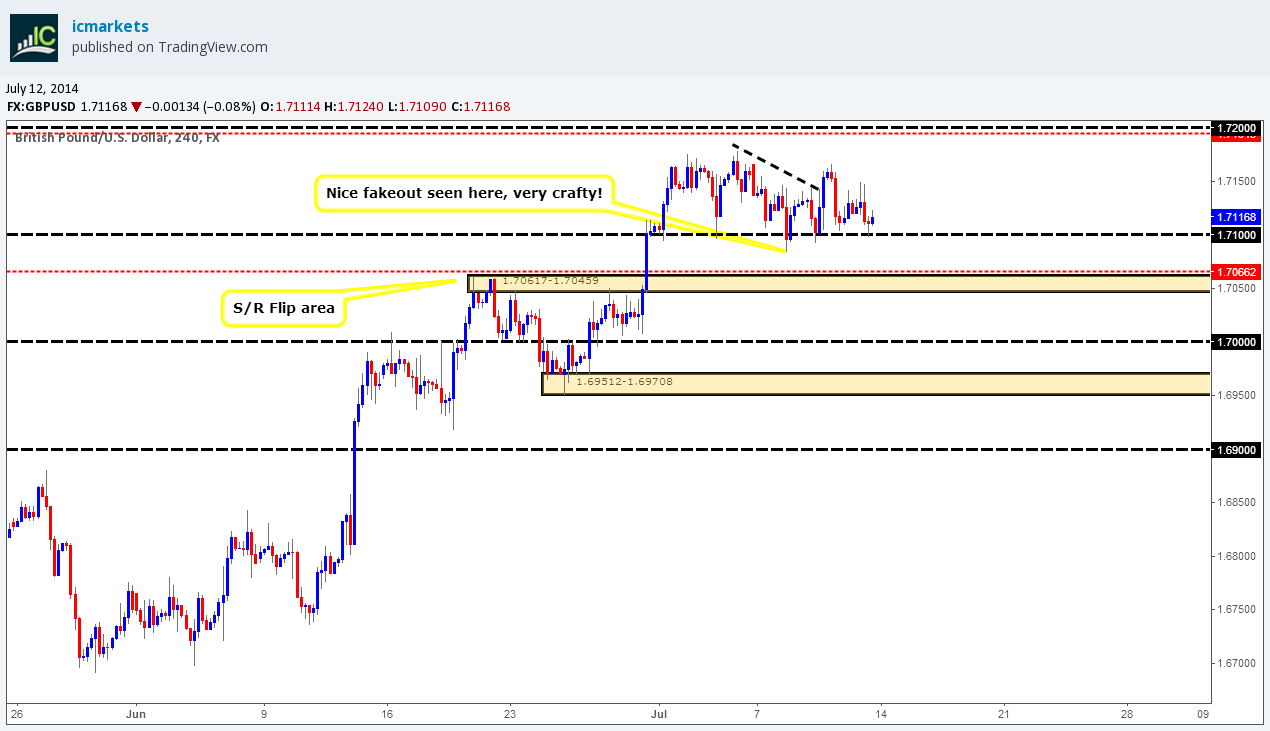
4hr TF.
We still expect higher prices on this timeframe; even though it sounds crazy considering we are deep within weekly supply (see above).
Considering the higher timeframes for a moment, pro money always wants the best prices. The daily supply area is possibly the best price within the weekly supply area (see above), hence pro money will likely still push prices higher but not without collecting the much-needed liquidity first!
Price is currently trading around a weak-looking round number 1.71000 due to this area seeing a few touches no doubt consuming the majority of the buyers originally trading there. So, where would be the next area pro money would look to bring price down to? The S/R flip area at 1.70617-1.70459 would be our guess, if they do bring price down this far, they will not only stop out the remaining buyers around the round number 1.71000 (collecting sell orders from their stops), they will also entice millions upon millions of breakout sellers’ to join in also, which pro money will gladly accept and buy into as price trades down to around the aforementioned 4hr S/R flip area.
Pending/P.A confirmation orders:
- No pending buy orders (Green line) are seen in the current market environment.
- P.A confirmation buy orders (Red line) are seen just above demand (1.70617-1.70459) at 1.70662. A reaction north is likely to be seen here as there is no doubt unfilled buy orders left around this area when pro money made the ‘decision’ to push higher. However deep spikes can occur around flip areas (levels above) such as these, hence the need to wait for confirmation.
- No pending sell orders (Green line) are seen in the current market environment.
- P.A confirmation sell orders (Red line) are seen just below the round number 1.72000 at 1.71943. We have placed a P.A confirmation sell order here simply because these psychological levels are prone to deep tests/spikes, so sometimes it is better to wait for that all important confirmation.
Quick Recap:
Sellers have begun showing a little interest within weekly supply at 1.76297-1.67702, while on the daily timeframe price is seen trading between daily supply at 1.76297-1.73024 and the daily S/R flip level below at 1.69712. Higher prices are expected don the 4hr timeframe, but not without a decline in value to at least the 4hr S/R flip level at 1.70617-1.70459.
- Areas to watch for buy orders: P.O: No pending buy orders seen in the current market environment. P.A.C: 1.70662 (likely to be set at 1.70423 TP: Dependent on approaching price action after the level has been confirmed).
- Areas to watch for sell orders: P.O: No pending sell orders seen in the current market environment. P.A.C: 1.71943 (SL: Dependent on price action after the level has been confirmed TP: Dependent on approaching price action after the level has been confirmed).
AUD/USD:
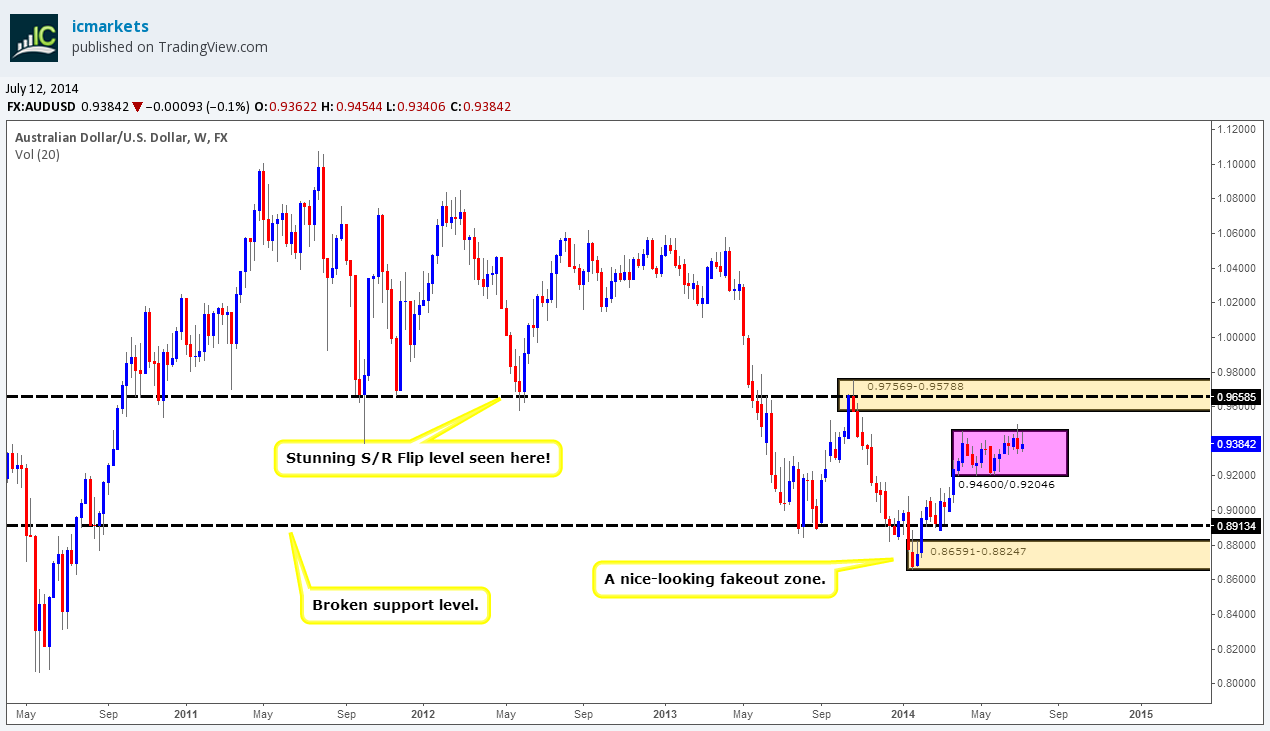
Weekly TF.
The weekly timeframe shows price has been consolidating for around 14 weeks now (0.94600/0.92046). The buyers did make an attempt to breakout north two weeks ago, but were quickly hammered back down to within the consolidation area.
The most recently closed weekly candle and the one previous has formed what the majority of traders call an inside candle, could a further breakout north to weekly supply above at 0.97569-0.95788 be brewing? Let’s take a peek at the lower timeframes to see what more information we can gather.
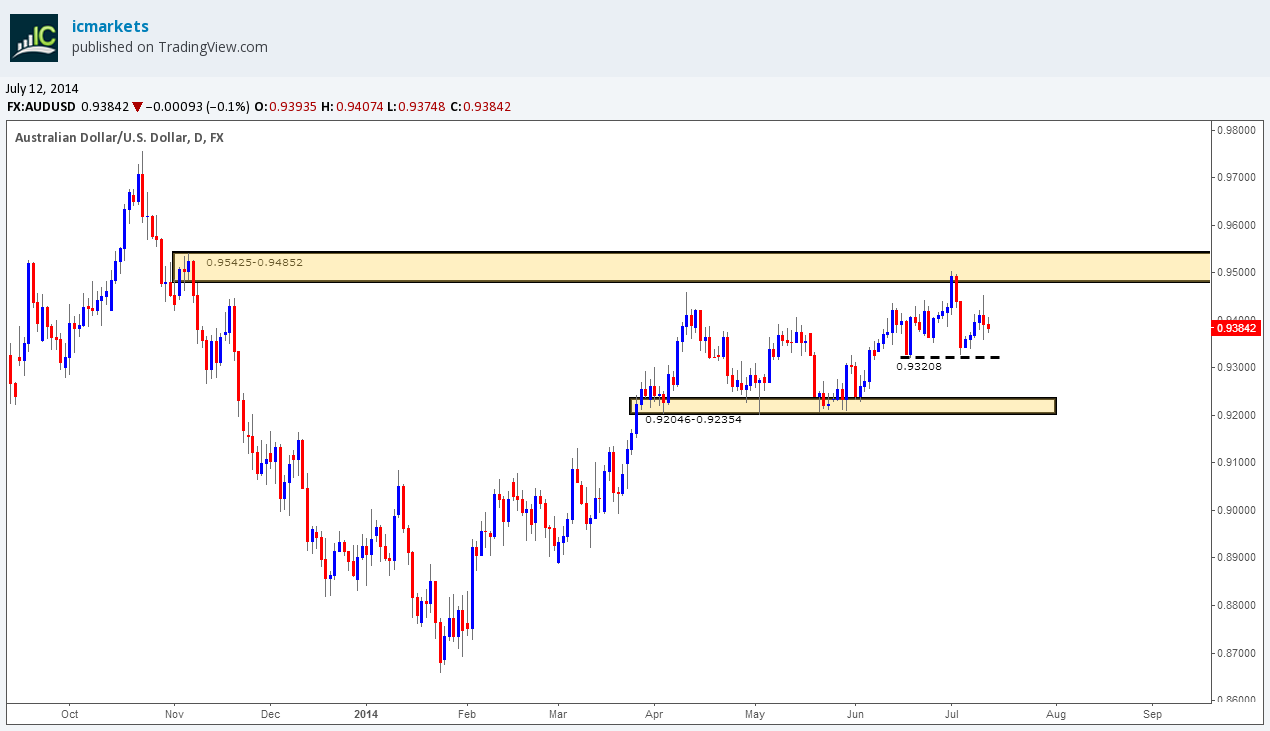
Daily TF.
Price is currently trading between the low 0.93208 and daily supply above at 0.95425-0.94852. If price positively closes above the aforementioned daily supply area, there is very little stopping it from reaching the weekly supply area just mentioned above, nonetheless, until we see a break of either of these areas mentioned, we do not have much in the way of possible direction for now.
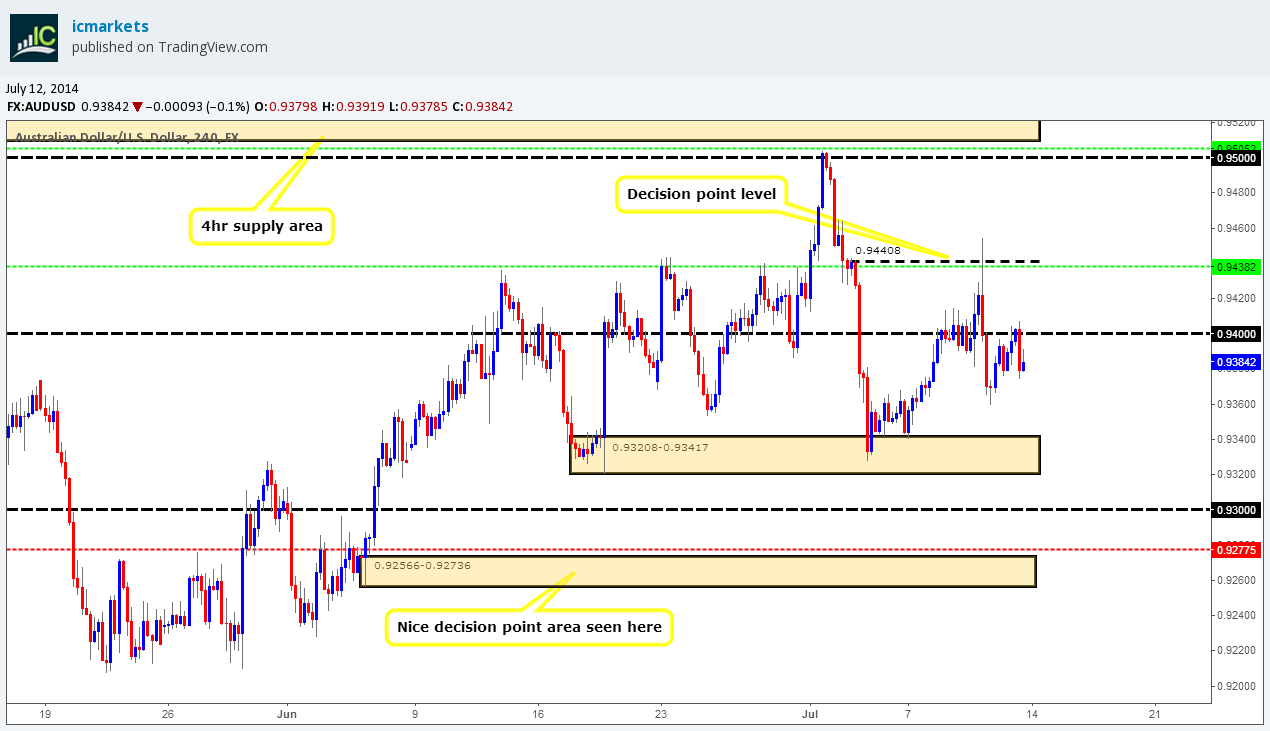
4hr TF.
A small retracement was seen from around the 0.93671 area up to the round number 0.94000. We still favor price declining to at least the 4hr demand area below at 0.93208-0.93417 which will possibly be seen early sometime this week.
Pending/P.A confirmation orders:
- No pending buy orders (Green line) are seen in the current market environment.
- P.A confirmation buy orders (Red line) are seen just above the decision point level (0.92566-0.92736) at 0.92775. The reason for placing a P.A confirmation buy order here rather than pending buy order is simply because we were trading just above a daily demand ‘buy zone’ at 0.92046-0.92354, meaning pro money could very well just ignore this level completely and trade deeper into the aforementioned daily demand area, so, confirmation is the order of the day!
- Pending sell orders (Green line) are seen just below supply (0.95425-0.95096) at 0.95052. A pending sell order is placed here due to this being an area where pro money was interested in before; see how close price came to the supply area? (Levels above), this indicates possible strong supply (selling pressure), so the next time price visits we can expect some sort of reaction.
- The pending sell order (Green line) set just below the decision point level (0.94408) at 0.94382 is now active. Our first take-profit target has been hit at 0.93678, so do keep an eye on our second target seen within 4hr demand below (0.93208-0.93417) at 0.93360.
Quick Recap:
Price is still seen consolidating on the weekly timeframe (0.94600/0.92046), while on the daily timeframe buyers and sellers are seen trading between the low 0.93208 and daily supply above at 0.95425-0.94852. The 4hr timeframe shows a small retracement was seen from around the 0.93671 area up to the round number 0.94000. We still favor price declining to at least the 4hr demand area below at 0.93208-0.93417 (our second target from the short position up at 0.94382 which will possibly be seen early sometime this week
- Areas to watch for buy orders: P.O: No pending buy orders seen in the current market environment. P.A.C: 0.92775 (SL: Dependent on price action after the level has been confirmed TP: Dependent on approaching price action after the level has been confirmed).
- Areas to watch for sell orders: P.O: 0.95052 (SL: 0.95467 TP: Depending on price approach)0.94382 (Active-1st target hit) (SL: 0.94677 TP: [1] 0.93678 [2] 0.93360 [3] 0.93000. P.A.C: No P.A confirmation sell orders seen in the current market environment.
USD/JPY:
Weekly TF.
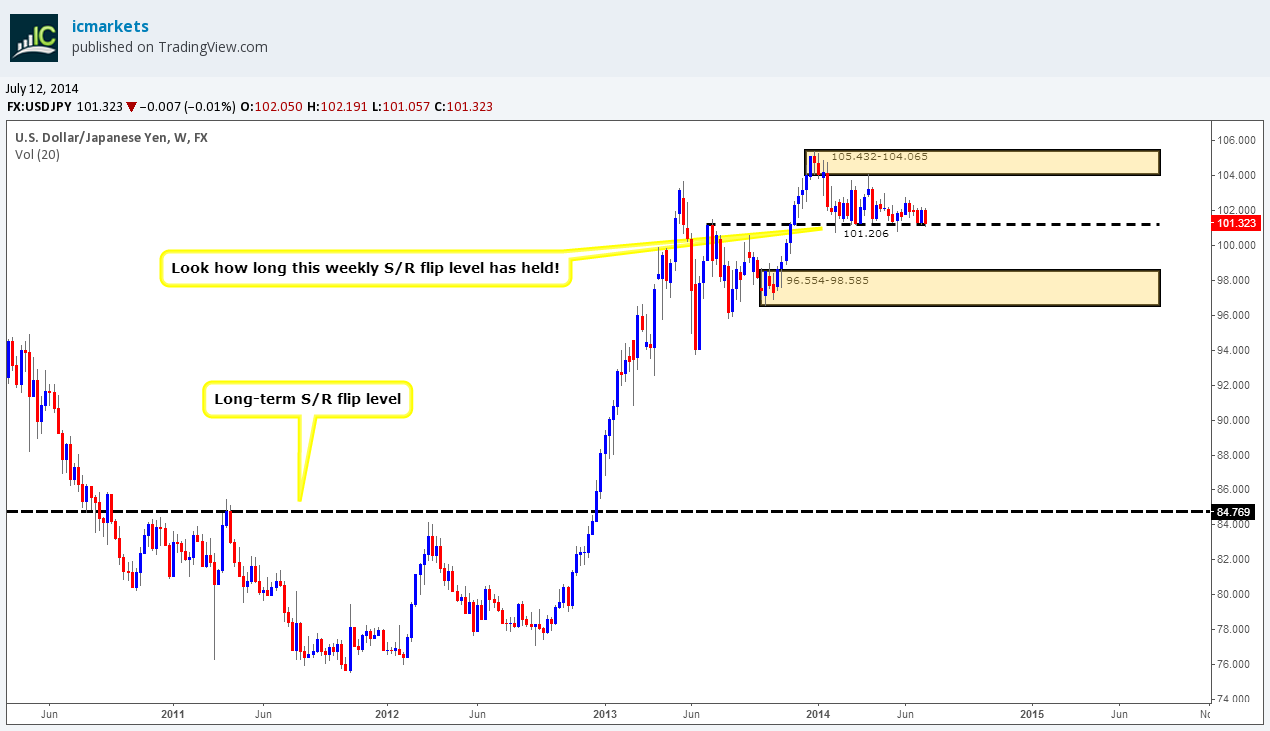
A long-term weekly S/R flip level at 101.206 is still holding price up nicely, with a close lower yet to be seen.
Daily TF.
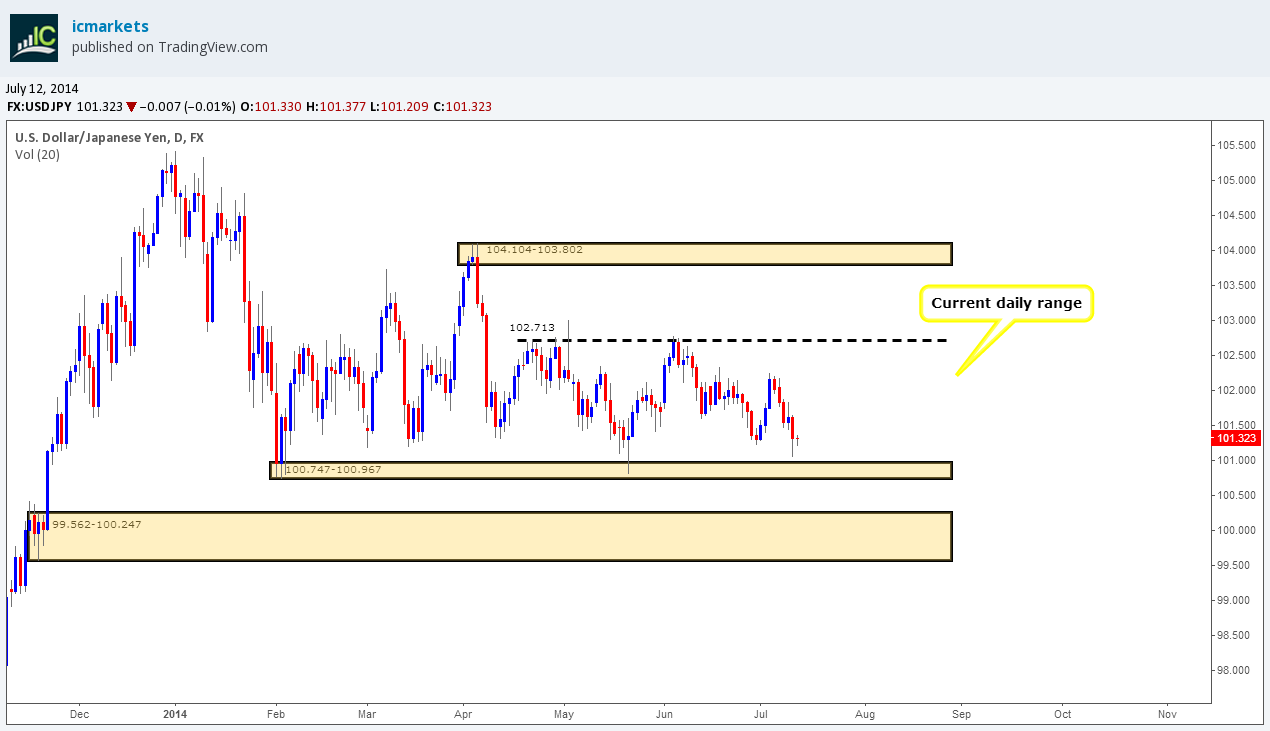
Price is currently capped between daily resistance above at 102.713 and daily demand below at 101.747-100.967. This price action we see here is a zoomed-in view of what is going on, on the weekly timeframe. So, with that in mind, take a look below the aforementioned daily demand area, and you’ll see a beautiful-looking daily demand zone at 99.562-100.247. This daily demand area could be used to help facilitate a fakeout of the weekly S/R flip level (levels above) as there are very likely some heavy active buyers around this area. Conversely, a positive close above the daily resistance level at 102.713 could force prices to test daily supply above at 104.104-103.802 as there is nothing really stopping price (to the left) from reaching this area.
4hr TF.
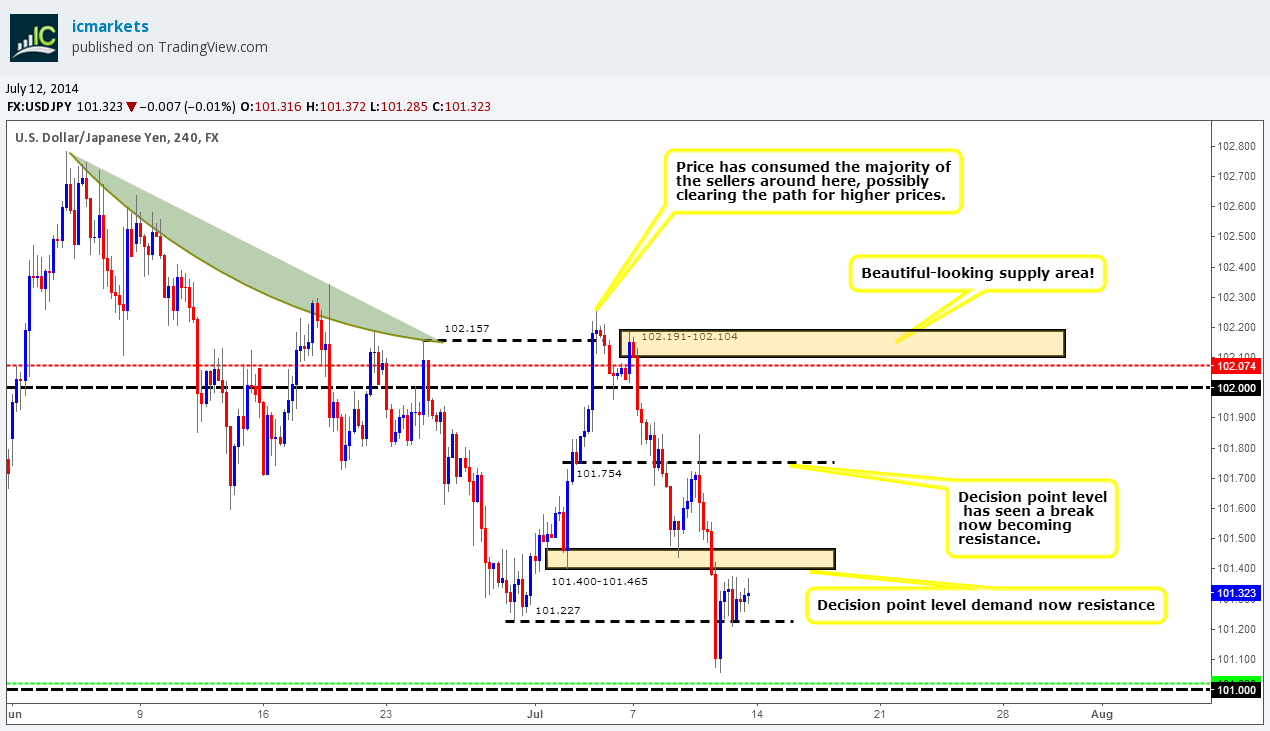
In the last analysis it was reported that we had seen a positive close below the low 101.227, thus potentially clearing the path down towards the round number 101.000. Price never made it that far; it missed the round number by about five pips!
Now let’s not forget that we are trading around some heavy higher-timeframe demand (Weekly: 101.206, Daily: 100.747-100.967), so higher prices are naturally expected from this level. The prior decision point at 101.400-101.465 will likely push price back down to the round number 101.000. Why would we think price will decline on this timeframe when we are trading around higher-timeframe demand? Take a look at the low 101.057, demand was so strong around the round number 101.000 area, it could not even reach it. Pro money likely sees this as an opportunity to stop out uninformed traders. Think for one moment how many traders will be attempting to buy around the aforementioned low, placing their stops just below the round number (level above); it will likely be an unimaginable amount! So to gain the much-needed liquidity, pro money could possibly sell hard into this low and below the round number triggering all the stops (which are now sell orders) thus allowing them to push prices higher. This is only one scenario, which could very well happen early sometime this week.
Pending/P.A confirmation orders:
- Pending buy orders (Green line) are seen just above the round number 101.000 at 101.020. The reason for setting a pending buy order here is because we are currently trading around weekly and Daily demand areas (101.206…100.747-100.967). We would not normally set a pending order around psychological levels such as these, but since we are in a great higher –timeframe location it is worth the risk (Weekly: 101.206 Daily demand: 100.747-100.967).
- No P.A confirmation buy orders (Red line) are seen in the current market environment.
- Pending sell orders (Green line) are seen just below supply (103.294-102.983) at 102.953. A pending sell order was set here due to this being an area where likely unfilled sell orders are.
- P.A confirmation sell orders (Red line) are seen just below supply (102-191-102.104) at 102.074. A P.A confirmation order was used here purely for the simple fact we are trading around a higher-timeframe weekly support level at 102.206 meaning we may see a small reaction, but nothing to write home about, hence the need for confirmation!
Quick Recap:
The weekly timeframe still shows the long-term support at 101.206 is holding price up, while on the daily timeframe price is trading just above daily demand at 100.747-100.967. Our pending buy order set just above the round number 101.000 at 101.020 on the 4hr timeframe was nearly hit last week; it came within five or so pips! We will still leave this pending buy order set, as a decline in value is still likely to be seen to around the aforementioned round number level sometime early this week.
- Areas to watch for buy orders: P.O: 101.020 (SL: 100.786 TP: Dependent on price approach).P.A.C: No P.A confirmation buy orders are seen in the current market environment.
- Areas to watch for sell orders: P.O: 102.953 (SL: 103.317 TP: Dependent on price approach).P.A.C:102.074 (SL: 102.214 TP: Dependent on approaching price action after the level has been confirmed).
EUR/GBP:
Weekly TF.
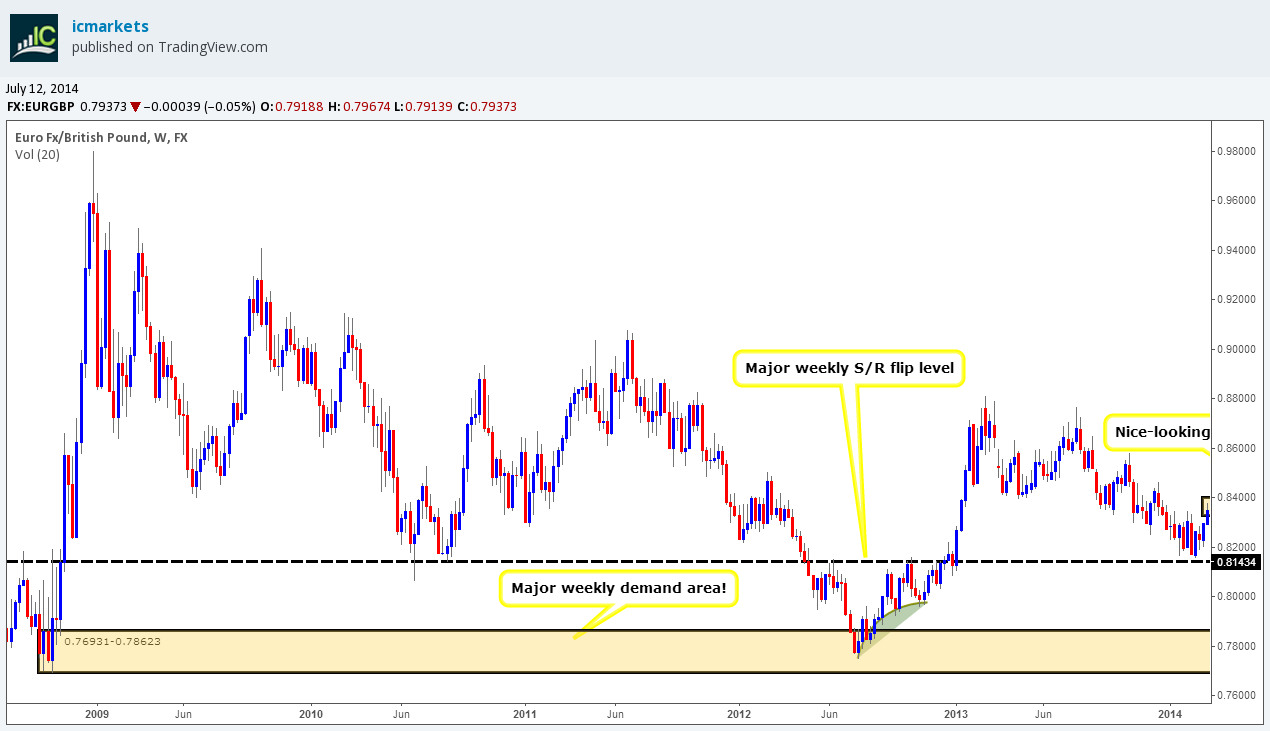
The buyers put in an appearance last week after the last week’s selling onslaught, nonetheless it was nothing to get excited about. As a reminder from last week’s weekly analysis, the green arc to the left resembles likely pro money activity in that when price rallied, a spike lower was made to consume the buyers thus clearing the path for sellers possibly down into weekly demand at 0.76931-0.78623. However on the lower timeframes there are likely areas of demand we cannot see on this timeframe, so let’s take a closer look.
Daily TF.
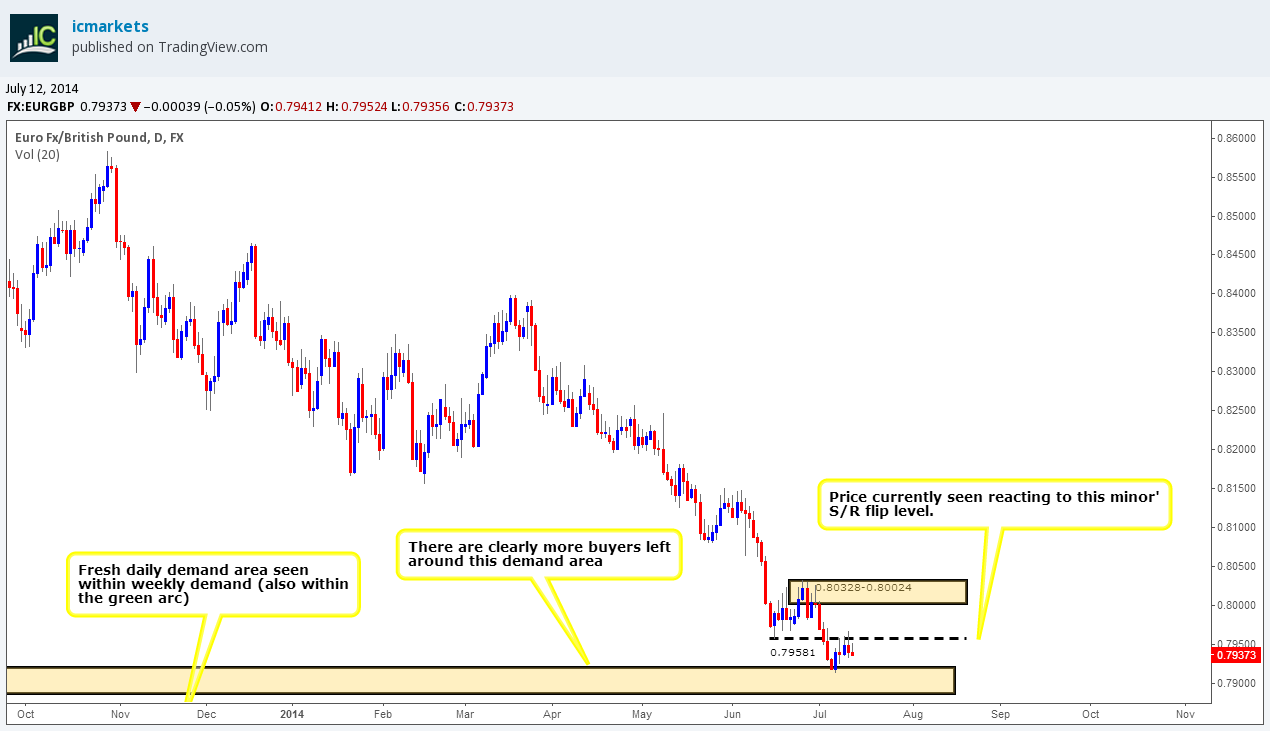
Two daily demand areas were found within the weekly green arc. The higher daily demand area of the two at 0.78862-0.79206 saw a reaction on Monday last week, which consequently rallied price up to the daily minor S/R flip level at 0.79581 where the sellers were seen to be active.
A break above this daily S/R flip level will likely see price testing oncoming daily supply at 0.80328-0.80024, conversely a break below this daily S/R flip level will likely push price down into the daily demand area at 0.78117-0.78533.
4hr TF.
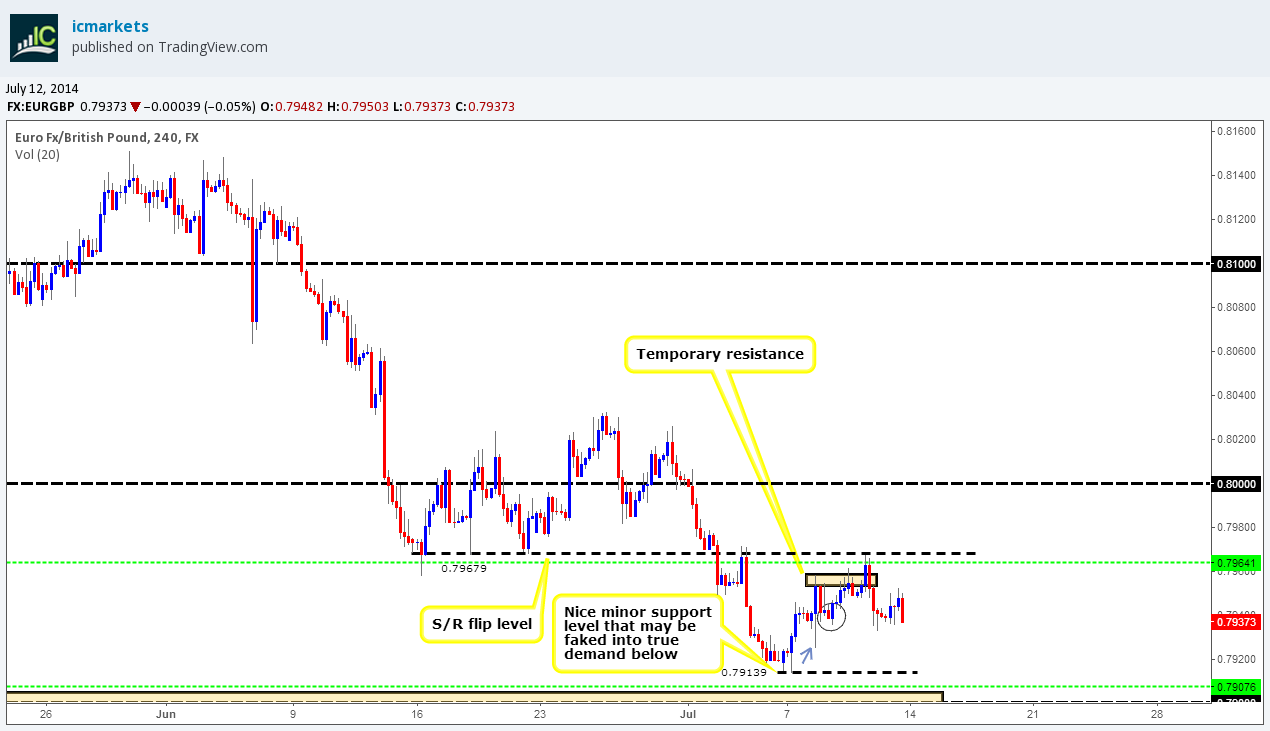
A reaction was indeed seen at the 4hr minor demand area (circled) as reported may happen in the last analysis, but was nothing to get excited about! A break below was seen late Friday meaning price could very well drop straight to the low 0.79139. The reason price could drop that far is because of the tail marked with an arrow, this tail was likely used to collect orders for the original advance, but in the meantime, it consumed buyers, thus clearing the path for sellers.
Now do bear in mind this low 0.79139 could well see a fakeout below into true 4hr demand at 0.78862-0.79048, but it is doubtful that this will be seen just yet.
Pending/P.A confirmation orders:
- Pending buy orders (Green line) are seen just above demand (0.78862-0.79048) at 0.79076. A pending buy order is placed here due to the aforementioned 4hr demand area’s location in the higher timeframes (Within the compressed green arc from weekly demand: 0.76931-0.78623… Seen on Monday 7th July analysis), and daily demand at 0.78862-0.79206.
- No P.A confirmation buy orders (Red line) are seen in the current market environment.
- The pending sell order (Green line) set just below the S/R flip level (0.79679) at 0.79641 is now active. Our first target has been hit at 0.79388, so do keep an eye on our second target below at 0.79139.
- No P.A confirmation sell orders (Red line) are seen in the current market environment.
Quick Recap:
The weekly timeframe shows the sellers are edging ever so close to weekly demand at 0.76931-0.78623 even with the pathetic attempt put in from the buyers last week! The daily timeframe shows price is capped between minor daily resistance at 0.79581 and daily demand below at .78862-0.79206 with a positive break of either side to be seen yet. A positive close below the minor 4hr demand area (0.79388) was seen, meaning we have a good chance of seeing lower prices down to the low 0.79139 which is our second and final take-profit level form the short position taken up at 0.79641.
- Areas to watch for buy orders: P.O: 0.79076 (SL: 0.78846 TP: Dependent on price approach)P.A.C: No P.A confirmation buy orders are seen in the current market environment.
- Areas to watch for sell orders: P.O: 0.79641 (Active – 1ST target hit) (SL: 0.79747 TP: [1] 0.79388 [2] 0.79139). P.A.C: No P.A confirmation sell orders are seen in the current market environment.
USD/CAD:
Weekly TF.
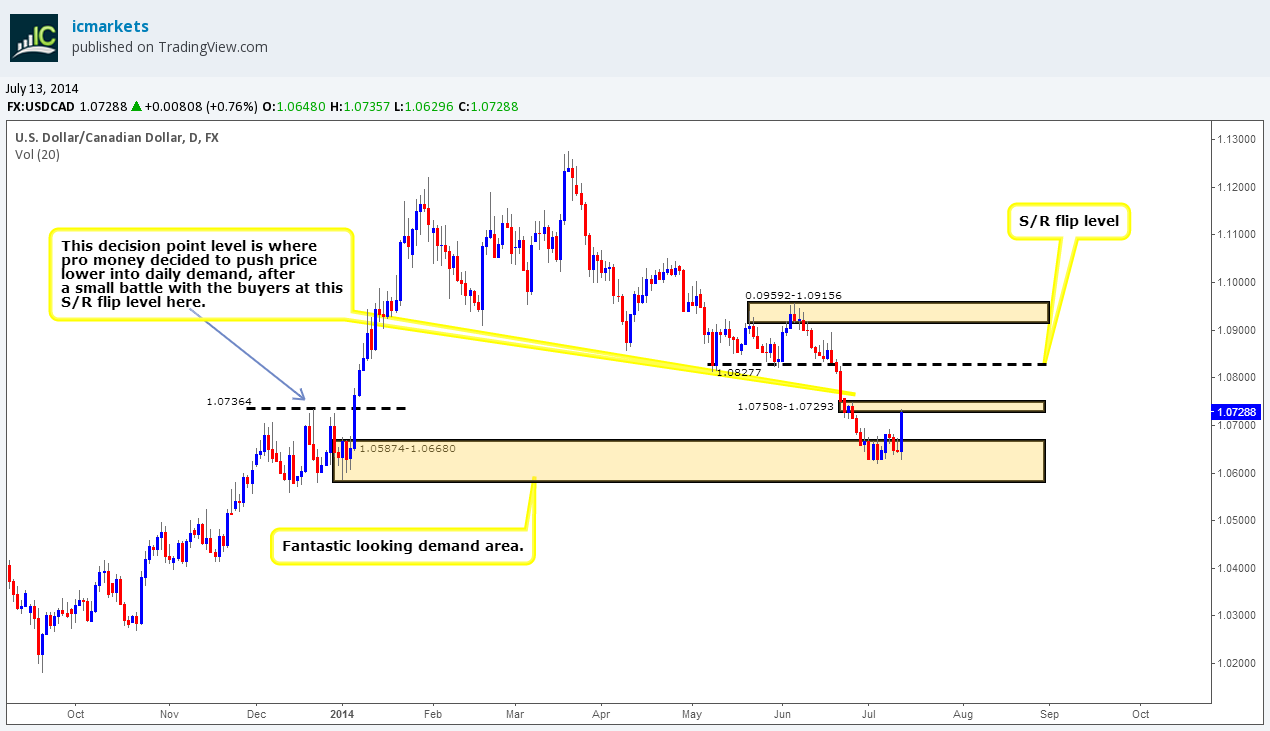
Would you look at that! A beautiful site! The buyers are beginning to show some energy trading out of weekly demand at 1.05715-1.07008, if this buying enthusiasm continues; we could be in for a long-term rally higher.

Daily TF.
The daily timeframe shows much the same as what the weekly timeframe does. However, we get a better view here; notice that price has traded right into a daily decision point area at 1.07508-1.07293. If price breaks this aforementioned decision point level, we can expect higher prices up to at least the S/R flip level at 1.08277.
4hr TF.
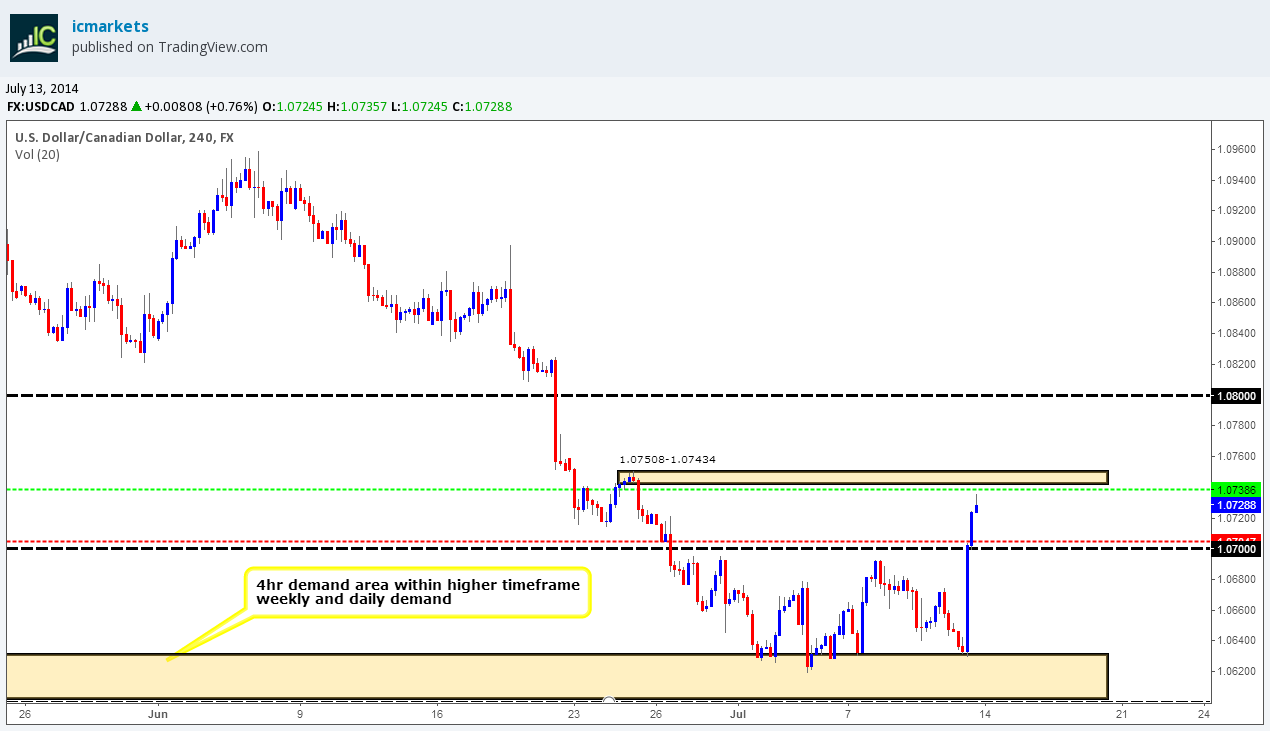
Wow! Don’t you just love it when price does this, look at that momentum. It was reported that price was very likely going to reach the round number 1.07000 above, but not before a push deeper into 4hr demand at 1.06041-1.06312 which no doubt would stop out some of the traders who were originally long there. As we can see all of the above did happen, and price took off like a rocket completely ignoring the aforementioned round number and just missing the 4hr supply area at 1.07508-1.07434.
A small retracement is expected to be seen to around the round number 1.07000 where a rally higher to the aforementioned 4hr supply area will likely be seen, if we see a break above this 4hr supply area, higher prices are expected to be seen at least up until the round number 1.08000.
Pending/P.A confirmation orders:
- The pending buy order (Green line) set within demand (1.06041-1.06312) at 1.06229 has been removed. Price rallied too far away from the entry level.
- The pending buy order (Green line) set just above demand (1.06041-1.06312) at 1.06462 hit the first target at 1.07000 and came very close to second and final target at 1.07386, so we decided to close the position in profit.
- New P.A confirmation buy orders (Red line) are seen just above the round number 1.07000 at 1.07047. The reason a P.A confirmation order was set here was simply because we expect a retracement down to this level very soon before price continues on higher, a pending buy order would be too risky as (on this timeframe) there is no logical area for a stop loss order to be placed.
- Pending sell orders (Green line) are seen just below a small supply area (1.07508-1.07434) at 1.07386. A pending sell order has been set here since a bounce from this area will likely be seen if/when price reaches here, as the momentum from this area was quite strong, indicating unfilled sell orders may still be set there.
- No P.A confirmation sell orders (Red line) are seen in the current market environment.
Quick Recap:
Buyers on the weekly timeframe have begun to show energy as they have pushed out of weekly demand at 1.05715-1.07008, whilst on the daily timeframe; a reaction out of daily demand at 1.05874-1.06680 trading directly into a daily decision point area at 1.07508-1.07293 was seen. Buyers smashed through the round number 1.07000 on Friday, enabling us to close our long position from 1.06462 in a nice profit. It is very likely a bearish retracement will be seen to the round number 1.07000 early this week where we have a P.A confirmation buy order set at 1.07047 before a rally higher into the 4hr supply area above at 1.07508-1.07434 happens.
- Areas to watch for buy orders: P.O: There are no pending buy orders seen within the current market environment. P.A.C: 1.07047 (SL: Dependent on price action after the level has been confirmed TP: Dependent on approaching price action after the level has been confirmed).
- Areas to watch for sell orders: P.O:1.07386 (SL: 1.07541 TP: Dependent on price approach)P.A.C: There are no P.A confirmation sell orders seen within the current market environment.
USD/CHF:
Weekly TF.
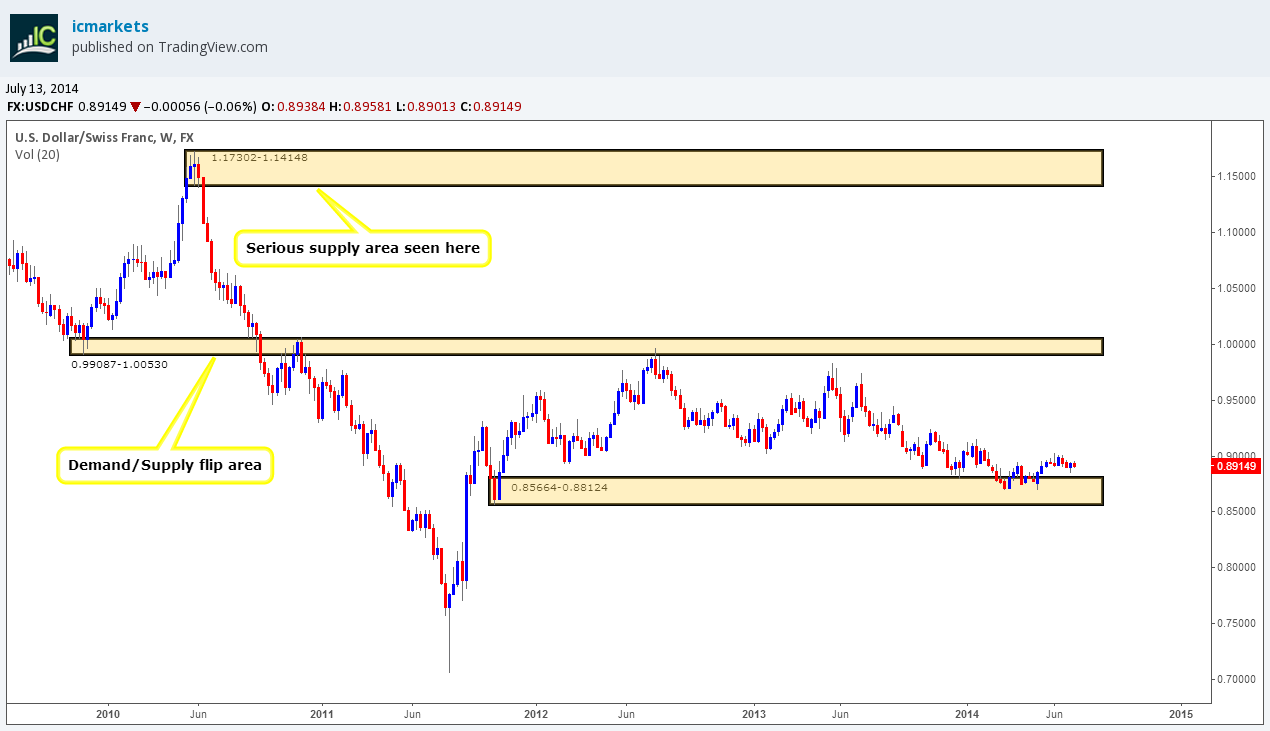
The weekly timeframe has not seen much change at all with price still seen consolidating just above weekly demand at 0.85664-0.88124.
Daily TF.
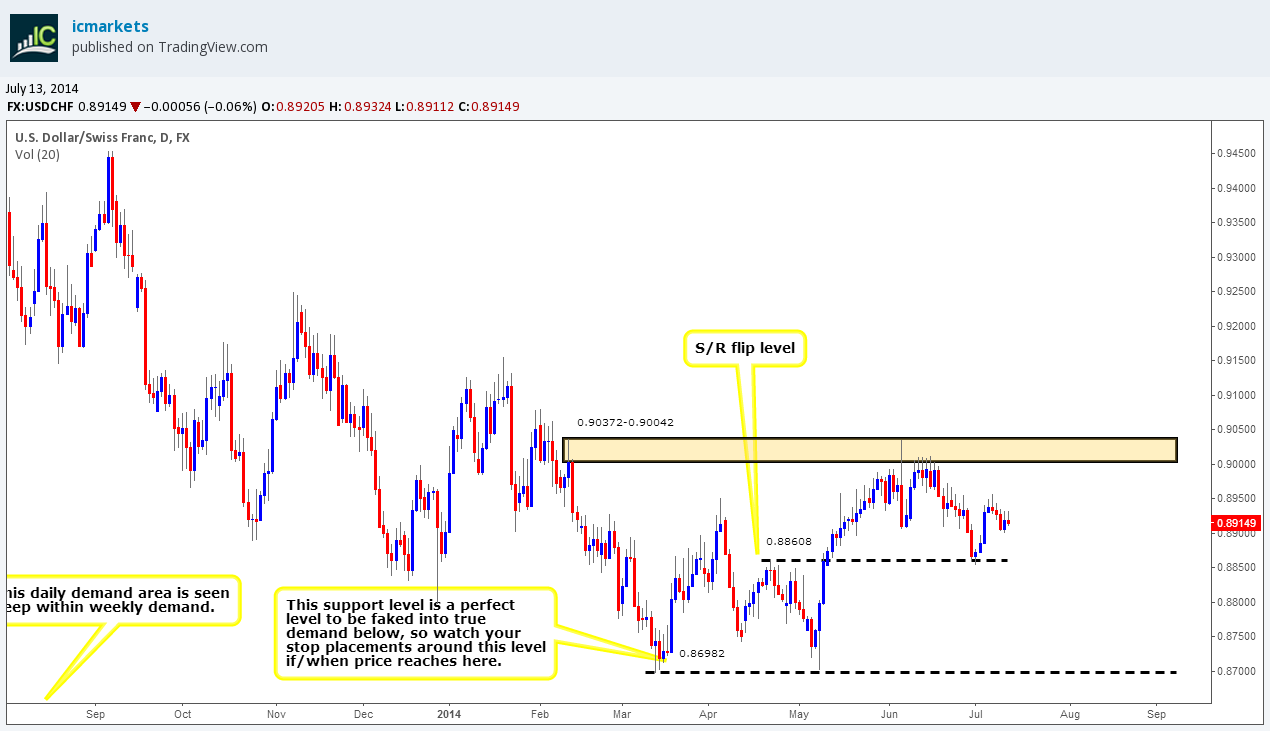
Price currently remains capped between daily supply above at 0.90372-0.90042 and the daily S/R flip level at 0.88608 with a break of either level yet to be seen.
4hr TF.
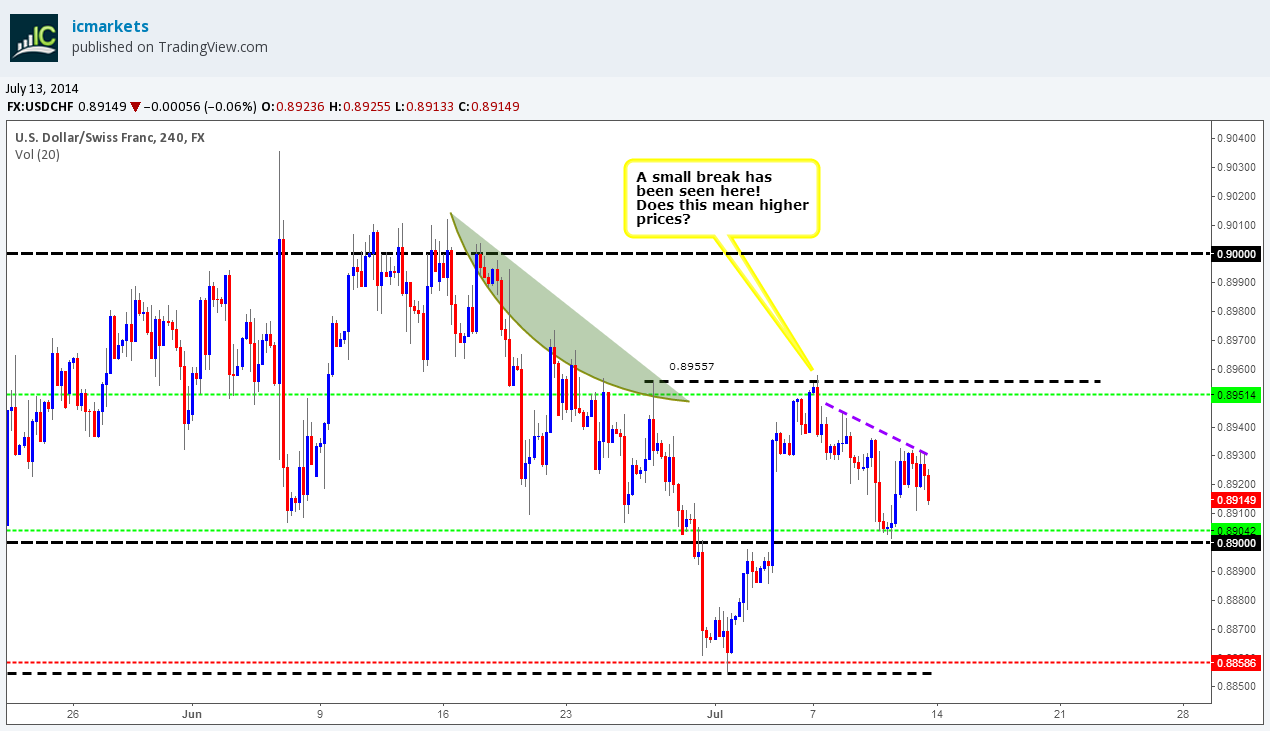
Price remains capped between the round number below at 0.89000 and the high above at 0.89557. Price will very likely trade down to the aforementioned round number very early on this week, with the possibility of higher prices being seen from here up to at least the high (level above).
For anyone that missed the last analysis where the purple trend line was explained, here it is:
Take a quick a look at the small purple trend line, this is not to resemble a trend as such, it is more to show how pro money have likely consumed supply/sellers as price was dropping possibly clearing the path for a nice advance back up to the high 0.89557.
Pending/P.A confirmation orders:
- Pending buy orders (Green line) are seen just above the round number 0.89000 at 0.89042. The reasoning behind placing a pending buy order and not a P.A confirmation buy order here is simply because we expect this area to see a reaction, as a decision was clearly made to rally prices in the first place. Agreed, it is not ideal, as on this timeframe there is not really any logical area for a stop loss order, well a tight one anyways.
- P.A confirmation buy orders (Red line) are seen just above the low 0.88546 at 0.88586. The reason that a P.A confirmation buy order was set here rather than a pending buy order was simply because there is no logical area for a stop loss, and the low (level above) will be likely prone to deep tests, or worse, a positive break below, hence the need to wait for confirmation.
- Pending sell orders (Green line) are seen just below the highs 0.89557 at 0.89514. The reasoning behind setting a pending sell order here is simply because the sellers proved to us that this level is worthy by consuming the buyers around the low 0.89245, thus permitting us to set this type of order.
- No P.A confirmation sell orders (Red line) are seen in the current market environment.
Quick Recap:
The weekly timeframe has not seen much change at all with price still seen consolidating just above weekly demand at 0.85664-0.88124, while on the daily timeframe Price currently remains capped between daily supply above at 0.90372-0.90042 and the daily S/R flip level at 0.88608 with a break of either level yet to be seen. The 4hr timeframe shows price is still capped between the round number below at 0.89000 and the high above at 0.89557. Price will very likely trade down to the aforementioned round number very early on this week, with the possibility of higher prices being seen from here up to at least the high (level above).
- Areas to watch for buy orders: P.O: 0.89042 (SL: 0.88886 TP: Dependent on price approach).P.A.C: 0.88586 (SL: Dependent on price action after the level has been confirmed TP: Dependent on approaching price action after the level has been confirmed).
- Areas to watch for sell orders: P.O: 0.89514 (SL 0.89624 TP: Dependent on price approach).P.A.C There are currently no P.A confirmation sell orders seen in the current market environment.
XAU/USD:
Weekly TF.
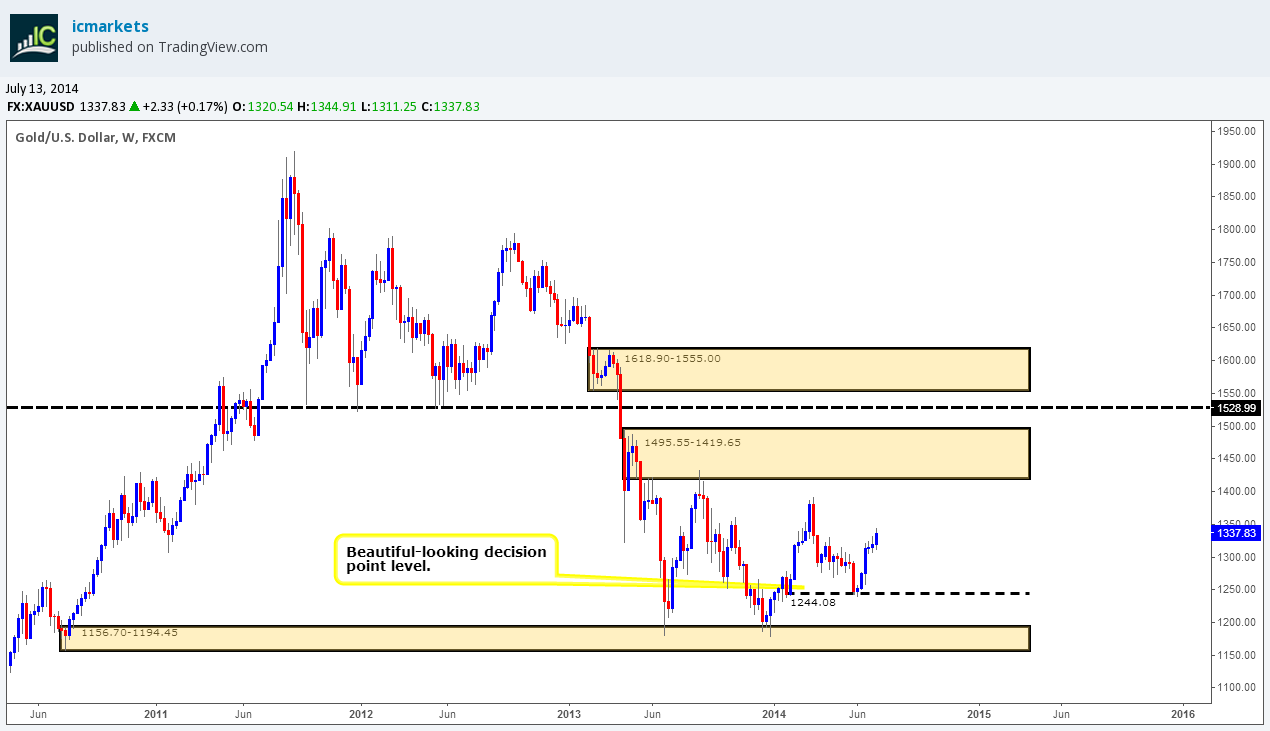
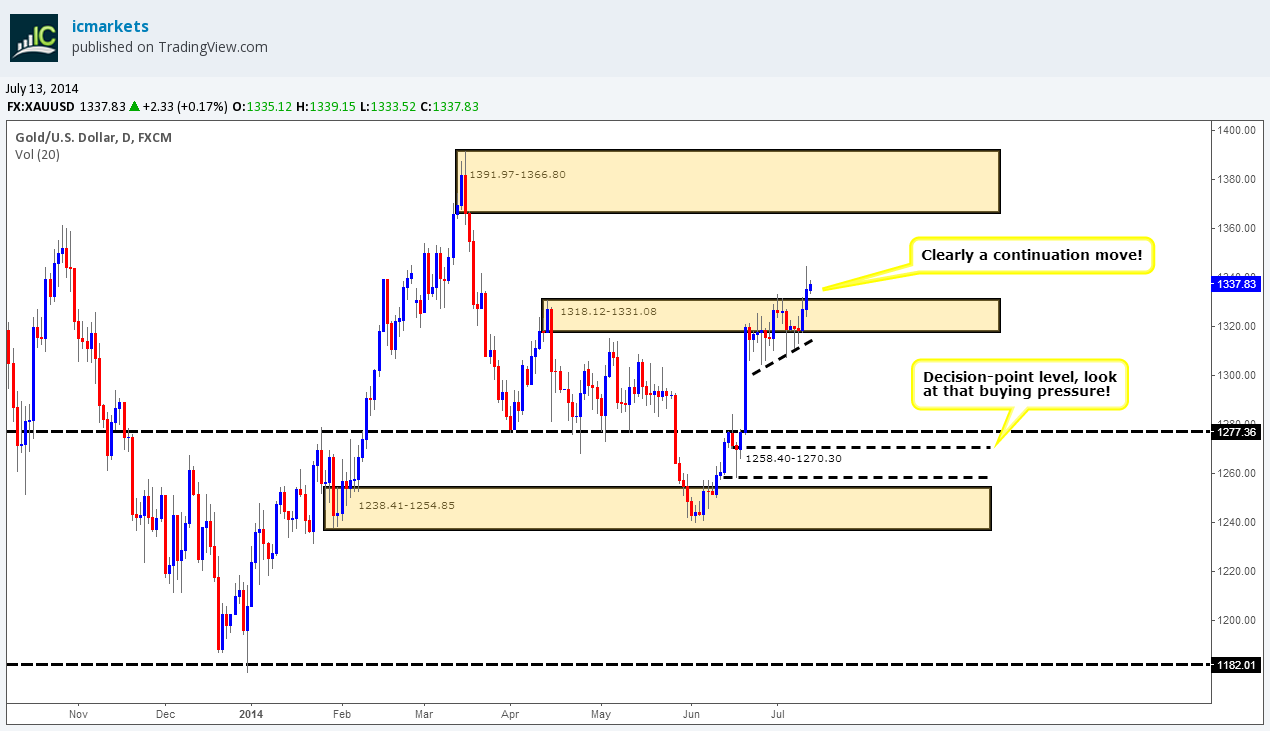
The weekly timeframe shows the buyers were in control for most of the week as price once again made a new weekly high at 1344.91.
Daily TF.
It is very clear that price is continuing higher as the daily supply area at 1318.12-1331.08 has been well and truly consumed now. Price is more or less free to hit the daily supply area above at 1391.97-1366.80, but we must remember price will rarely just shoot straight there no matter how much we want It to! A bearish retracement will likely follow which could see prices testing as low as the daily demand level below at 1238.41-1254.85 before we see a touch of the aforementioned daily supply area above.
4hr TF.
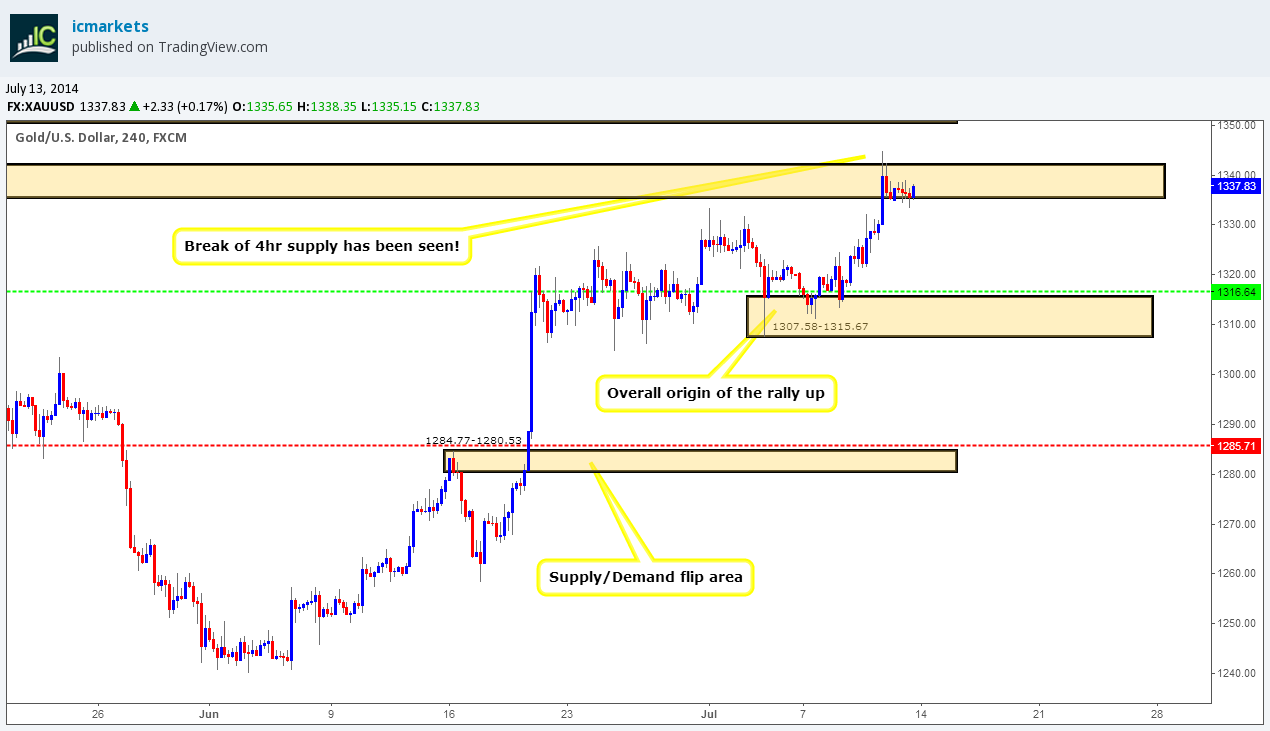
Unfortunately, price has not changed much since the last analysis, so our original analysis still holds very true:
Price has seen a strong advance possibly consuming the majority of the sellers in and around 4hr supply at 1342.30-1335.74. Logically speaking, price is now free to hit the above 4hr supply at 1363.99-1350.62, however before it does that, price could very well drop to 4hr demand below at 1307.58-1315.67.
Pending/P.A confirmation orders:
- Pending buy orders (Green line) are seen just above demand (1307.58-1315.67) at 1316.64. A pending buy order was set here purely because of the fact this was the origin of the rally up into supply at 1342.30-1335.74, and when price returns to the origin a reaction is normally seen.
- P.A confirmation buy orders (Red line) are seen just above the S/D flip area (1284.77-1280.53) at 1285.71. We have set a P.A confirmation buy order here simply because we could not find a logical area for the stop-loss order, so to avoid any deep spikes; we have decided to wait for confirmation.
- No pending sell orders (Green line) are seen in the current market environment.
- No P.A confirmation sell orders (Red line) are seen in the current market environment
Quick Recap:
Exactly the same as the last analysis:
The buyers have pushed above daily supply at 1318.12-1331.08 opening the possibility to higher s prices up to oncoming daily supply at 1391.97-1366.80. Likewise the 4hr timeframe has seen a break above 4hr supply at 1342.30-1335.74 opening the possibly to higher prices up to oncoming 4hr supply at 1363.99-1350.62. However do remain aware a retracement could very well be seen on the 4hr timeframe right down to 4hr demand at 1307.58-1315.67 before we hit the upper 4hr supply area just mentioned.
- Areas to watch for buy orders: P.O: 1316.64 (SL: 1306.01 TP: Dependent on price action approach). P.A.C: 1285.71 (SL: (SL: Dependent on price action after the level has been confirmed TP: Dependent on approaching price action after the level has been confirmed).
- Areas to watch for sell orders: P.O: There are currently no pending sell orders seen in the current market environment. P.A.C: There are currently no P.A confirmation sell orders seen in the current market environment.
Source: Monday 14th July: Weekly technical outlook and review.


