Previous Story
Monday 18th May: Weekly technical outlook and review

EUR/USD:
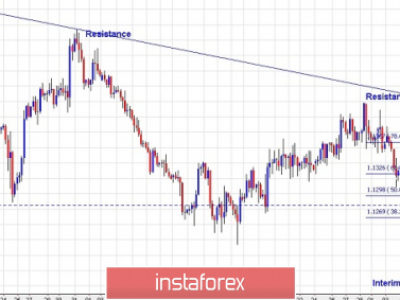
Weekly view: From the weekly timeframe, we can see that the Euro has rallied now for five consecutive weeks, subsequently forming higher highs each time. Last week’s candle, as you can see closed near it highs at 1.1442, deep within a weekly supply area at 1.1532-1.1278. This has been the most we’ve seen the EUR/USD rally since the market began to plummet back in May 2014. In spite of this, our long-term bias still remains south on this pair and will continue to do so until we see a convincing push above this weekly supply area.
Daily view: The bullish reaction seen from daily support at 1.1143 was clearly the motivator, if you will, to attract further buyers into the market last week. From this level, the bulls pressed forward eventually attacking the daily Harmonic Bat reversal zone at 1.1516/1.1376 (located deep within the aforementioned weekly supply area) for the second time. Instead of selling interest being seen from this area, we saw Friday’s daily candle close above a daily Quasimodo resistance level at 1.1421 seen within this Daily Harmonic Bat zone. If the buyers manage to hold their positions above this hurdle this week, it’s likely we may see further upside to this pair.
4hr view: In the midst of Friday’s sessions, the Euro pair sold off from the 1.1400 number– faked below the swing low 1.1338 seen marked in green, and saw a sharp rally north consequently taking out 1.1400 and testing the 4hr resistance level seen at 1.1443 (positioned relatively deep within the aforementioned daily Harmonic Bat zone).
So that we’re all on the same page here, let’s just recap. The weekly chart shows price currently dancing within supply at the moment, that’s easy enough for everyone to see. The daily chart on the other hand, is not so straight forward. Granted, price is trading within a daily Harmonic Bat reversal zone, but with Friday’s close seen above the aforementioned daily Quasimodo resistance level it does not exactly instill confidence for us to begin looking for sells (see above for all higher-timeframe levels). So where does this leave us on the 4hr chart?
As far as we can see, there is not really much room for price to move at the moment unless one is looking for small intraday trades. A move north from current price will almost instantly place the Euro within the jaws of a relatively long-term 4hr supply area coming in at 1.1532-1.1476 (located deep within the aforementioned weekly supply area). A push south from the aforementioned 4hr resistance level on the other hand, will very likely just as quickly see price shake hands with 1.1400. In the same way, should a break below this number be seen, price will in all likelihood greet 4hr demand at 1.1322-1.1358 not too long after. We’re sure you’re getting the picture by now…Unless there is an explosive move seen today, traders are likely going to be forced to look for only small intraday moves, or simply not trade at all.
Personally, we’re not interested in intraday trading today, especially on Mondays when liquidity is generally low in the market place. For anyone who is intending to trade any of the above levels, we would strongly advise waiting for some sort of lower timeframe confirming signal before risking capital.
Levels to watch/live orders:
- Buys: Flat (Predicative stop-loss orders seen at: N/A).
- Sells: Flat (Predicative stop-loss orders seen at: N/A).
GBP/USD:
Weekly view: Recent events on the weekly timeframe show that the GBP pair continued to advance last week, taking out weekly supply at 1.5551-1.5391, and driving itself very deep into a weekly supply area seen above at 1.5824-1.5634. The past month or so has been the most we’ve seen Cable rally since price began to sharply sell off back in mid-July 2014. Despite this, our long-term bias will remain short on this pair until a convincing close above the current weekly supply area is seen.
Daily view: What we’re seeing from this timeframe is price has literally been on fire since Friday 8th May, completely ignoring both the 1.5478 daily level, and also the daily swap area 1.5619-1.5567. It is only once price collided with a daily resistance area seen at 1.5824-1.5734 did we see any noteworthy selling interest form. The question we now need to be asking ourselves is, was this genuine selling interest here or simply traders covering positions for the week? Let’s take a look at the 4hr timeframe to see what we can find…
4hr view: The European session began Friday’s main movement with a sell off. This continued into the London session which as a result saw price attack the 1.5700 number. As we can see, buying interest was clearly present here, as the market was driven northbound to 1.5800, which was defended going into the U.S session, resulting in the market closing the week at 1.5723.
Considering the market’s overall position on the higher timeframes at the moment (see above), we’ll likely see the market retest 1.5700 which will be a key number for our traders today. In the event that buyers manage to maintain a position above this number, we could potentially be in for another ride north to visit 1.5800. Nonetheless, entering long here into all the higher-timeframe supply (see above) is a risky trade in our book, but depending on how the lower timeframes behave, we may consider a small position long from here.
A violation of 1.5700 on the other hand, could stimulate a decline down towards at least 1.5600, or possibly the 4hr demand area seen just below it at 1.5556-1.5580. We’d only be interested in shorting this market, however, if 1.5700 was successfully retested as resistance. The reason for why we believe the market could drop thus far is simply because of the price action seen within the green circle. The long buying tail at 1.5632 was likely the work of pro money. A spike south such as this was possibly used to collect unfilled buy orders to continue rallying north from 1.5700, thus once price returns to, or near to this area, there will not likely be much support left until 1.5600.
Levels to watch/ live orders:
- Buys: 1.5700 region [Tentative – confirmation required] (Predicative stop-loss orders seen at: dependent on where one confirms this area).
- Sells: Flat (Predicative stop-loss orders seen at: N/A).
AUD/USD:
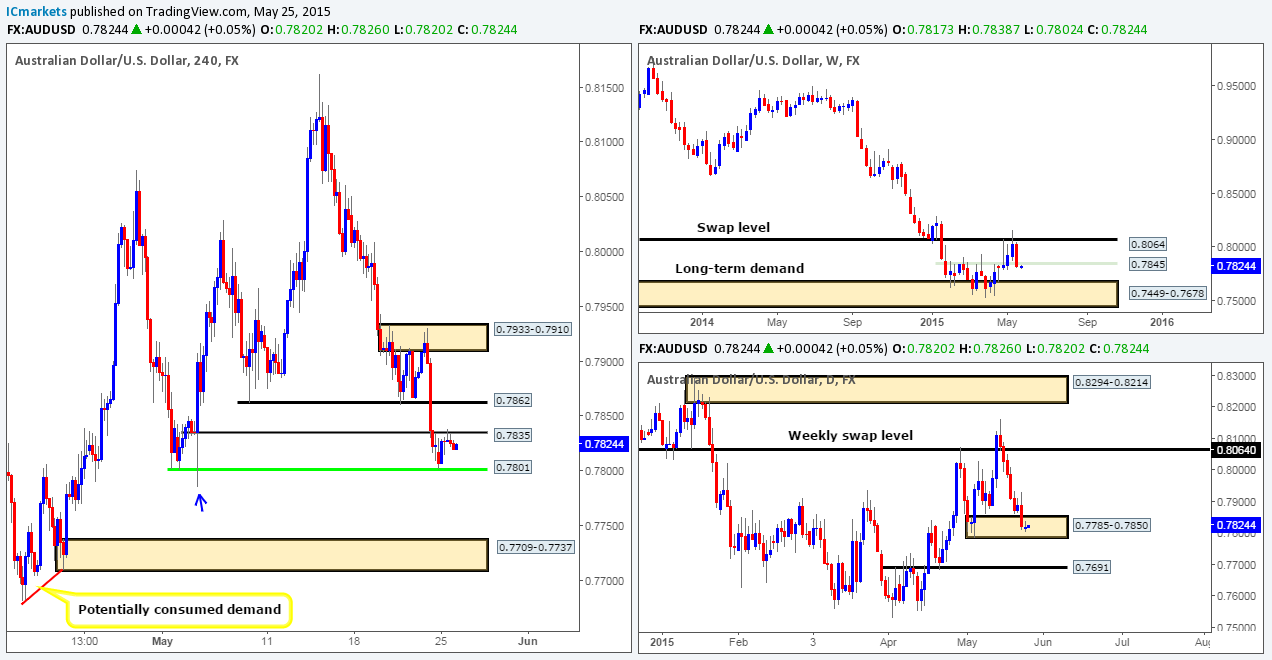
Weekly view: Last week saw the AUD/USD market trade higher, resulting in price attacking the weekly swap level seen at 0.8064. We can all see that price rebounded from this weekly level, but was it enough to keep the buyers under control? The rebound did not force the market to close bearishly, in fact, price closed the the week at 0.8030, only a pip higher than last week’s high! Not exactly what one wants to see from a weekly resistance level is it?
Daily view: The daily timeframe shows that the minor daily swap level coming in at 0.8022 held firm going into the close. That being said though, the bears were aggressive coming in to this level, which may suggest a further push south could be in store today and possibly into the week. In the event that a close below this level is seen, further selling could ensue down towards the daily demand area seen at 0.7862-0.7927, which, in our opinion, was where the initial decision was made to break above the aforementioned weekly swap level, hence there may very well be unfilled buy orders still lurking here.
4hr view: In the thick of the European session, price was heavily sold into. This continued as we entered into London’s business hours, which as a result saw prices collide with the large psychological number 0.8000. Things started to heat up around this level as U.S traders began placing their orders. Price rallied from here, aggressively attacking and slightly rebounding from a 4hr supply area at 0.8066-0.8044 (located just below the aforementioned weekly swap level), which incidentally, was the area created during the European session.
The reaction seen from the current 4hr supply area, however, may not have been genuine selling interest. Rather, it could have been longs covering their intraday positions into the close. With everything taken into consideration, selling from this 4hr supply zone would likely be a stressful endeavor in our opinion. This is definitely not us saying a short from here would not work out. Nonetheless, by selling here you would effectively be shorting into potential daily support at 0.8022. ‘But price is at a weekly swap level at 0.8064, so why is a short from current 4hr supply going to be stressful’ we hear you saying. True, it is, but the rebound from this level, and the prior weekly close was not enough for us to believe this market is ready to sell off from here, more like it is poising for a breakout north.
With all of the above taken on board, we have decided to humbly step aside on any short signals seen from the current 4hr supply area, it is just not worth the risk in our opinion. If we’re right in our analysis, a close higher above the 4hr supply area should be seen today, and as long as price retests this area as demand and shows lower-timeframe support holding firm, we’ll then likely take a long position here. Frist troublesome area to watch out for should this all occur is of course the 0.8100 number, but judging from its past, it has not proven to be a stable number. Therefore, we believe a break above this level will likely follow and send price to test the highs 0.8134.
Levels to watch/ live orders:
- Buys: Flat (Predicative stop-loss orders seen at: N/A).
- Sells: Flat (Predicative stop-loss orders seen at: N/A).
USD/JPY:
Weekly view: For two months, the weekly timeframe has barely seen any change. The buyers and sellers continue to battle for position within a weekly demand area coming in at 118.22-119.40. Our long-term bias will remain north on this pair as long as price continues to trade above the weekly swap level seen below this area at 115.50.
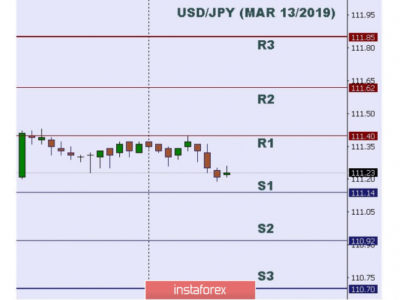
Daily view: From the daily scale, we can see that a clear consolidation zone has been chiseled out within the aforementioned weekly demand area between daily support seen at 118.62 (located deep within the aforementioned weekly demand area), and a daily Quasimodo resistance level coming in at 120.35. Recent movements over the past two weeks, however, has seen price BEGIN to form what we like to call a mini consolidation zone within the larger range (120.16/119.01). As you can see, price closed around the lower limits of this mini zone, so for any traders considering selling right now, you may want to take a note of this.
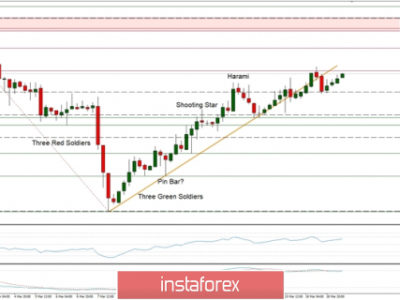
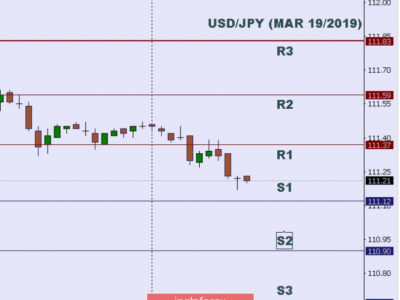
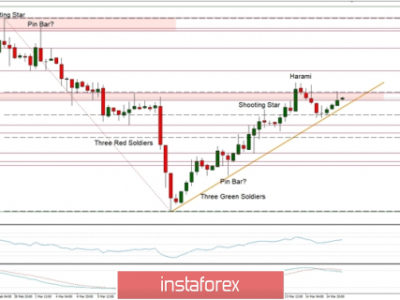
4hr view: The USD/JPY pair saw a beautiful to-the-pip reaction from the 4hr supply area seen at 120.03-119.84 on Friday. This move forced the market to aggressively sell off down to a minor 4hr swap level at 119.31, which also converges beautifully with the Fibonacci retracement number 0.618 seen in pink.
Considering both the weekly and daily timeframes are trading around demand at the moment (see above); we’re favoring a move higher on this pair sometime this week. With that, the minor 4hr swap level we just discussed above at 119.31 will be our first port of call today. If and only if we see the lower timeframe buying strength come into the market, we may consider a long position here, targeting the immediate 4hr supply area seen above at 120.03-119.84. However, In the event that 119.31 fails to hold today, our attention will then shift to the green ‘buy zone’ seen at 119.06-118.87. This area comprises of not only demand from the recent surge north, but also a 4hr trendline extended from the low 115.84 and a psychological border at 119.00—not a bad place to be looking for a long entry!

Levels to watch/ live orders:
- Buys: 119.31 [Tentative – confirmation required] (Predicative stop-loss orders seen at: dependent on where one confirms this level).
- Sells: Flat (Predicative stop-loss orders seen at: N/A).
USD/CAD:
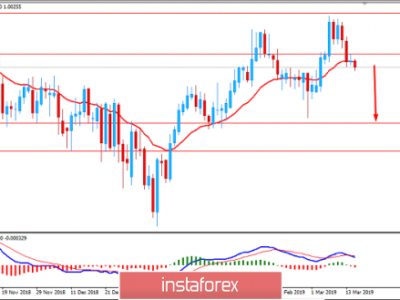
Weekly view: Last week’s action clearly shows that the sellers continued to overwhelm the buyers around the weekly swap area seen at 1.2034-1.1870. Notice how last week’s candle, and the one before it, closed below the prior candle’s close, which is not really something investors want to be seeing in potential demand. In the event that this area gives way, the path south will then likely be free for the sellers to challenge weekly demand seen at 1.1547-1.1672.
Daily view: Over the past three or so weeks, price has been seen bouncing off of a daily demand area at 1.1931-1.2045, which converges just beautifully with a Harmonic Bat support zone completing just below it at 1.1921. As bullish as this sounds, the reactions seen from this zone have not exactly filled us with the urge to begin buying this pair, quite the opposite in fact. Each time a reaction is seen, selling pressure slams price back down, and as there have been no higher highs formed here, it’s clear to us who is winning this mini battle at the moment.
4hr view: The beginning of the London session saw the USD/CAD break above huge round-number resistance at 1.2000. This buying continued throughout London’s morning session up to a 4hr swap area coming in at 1.2034-1.2048. Once the US traders began placing their orders, price saw a quick spike above this 4hr area, presumably to take out stops and sold off back down to retest 1.2000, which did not exactly see much of a reaction into the close 1.2008.
With everything taken into consideration, here is what we believe may take place in the market today and into the week… Provided that the 1.2000 psychological number holds the market higher, price will likely take off north.
Just to be clear here before we continue, we have no intention of looking for buys around 1.2000 simply because we have little faith left in the higher-timeframe demand areas discussed above. We’d rather let the market come to our predetermined areas.
To continue… Buy stops, as already mentioned, have likely been taken out around the aforementioned 4hr swap area, thus potentially opening the gates for prices to challenge the 4hr sell zone seen in green at 1.2085-1.2103, which as far as we can see, converges with the following: round-number resistance 1.2100, Fibonacci retracement number 0.786, clear 4hr supply to the left marked in yellow at 1.2112-1.2088, and last but not least the trendline buffers extended from the high 1.2304. This area is the only place we would currently consider selling at, and is where we are hoping price will advance to from 1.2000 early on in the week.

Levels to watch/live orders:
- Buys: Flat (Predicative stop-loss orders seen at: N/A).
- Sells: 1.2085-1.2103 [Tentative – confirmation required] (Predicative stop-loss orders seen at: Will likely be placed around the 1.2117 region).
USD/CHF:
Weekly view: From this angle, we can see that the sellers were clearly in control of this market last week, consequently forcing price to close at 0.9155, just below the weekly demand area at 0.9343-0.9180. Usually, we’d say that price is now likely headed for the weekly swap level seen below at 0.9018, and don’t get us wrong, it could still well be, but we just would have preferred to see price also break the prior week’s low at 0.9070 as well. It will be interesting to see what the lower timeframes have to say about this…
Daily view: The daily timeframe shows us that price closed below a small daily demand area at 0.9155-0.9206 on Thursday, and respected this area as supply going into the close on Friday. Assuming that the sellers can keep the buyers at bay here, it’s likely we’re headed down to the next decision point–a daily demand area coming in at 0.8933-0.9045, which surrounds the weekly swap level mentioned above at 0.9018.
4hr view: The USD/CHF pair rallied throughout the European/London morning sessions on Friday, aggressively breaking above the 0.9200 number. Once the U.S session got in to gear though, the tables clearly turned and price, just as aggressively, sold off back through 0.9200 to a clear 4hr buy zone marked in green at 0.9137/0.9090. One has to feel for any poor soul trying to trade 0.9200 that day!
From both the weekly and daily timeframes it looks as though price is headed south in our opinion (see above). However, on the 4hr timeframe, there is a ton of support to break through first which we believe will be no easy feat! The green buy zone just mentioned above holds within it round-number support at 0.9100, a clear 4hr support level seen at 0.9112 and also the Fibonacci retracement numbers 0.786/0.886. This area will very likely see some sort of reaction today, potentially pushing this market up towards 0.9200. For anyone wishing to buy within this zone, we would highly recommend waiting for lower-timeframe price action confirmation beforehand.
In the event that this buy area is taken out, however, our attention will then shift towards the 4hr demand area seen below it at 0.8984-0.9068, which remains, in our opinion, the final obstacle to a move towards the daily demand area mentioned above at 0.8933-0.9045.

Levels to watch/ live orders:
- Buys: 0.9137/0.9090 [Tentative – confirmation required] (Predicative stop-loss orders seen at: dependent on where confirms this area).
- Sells: Flat (Predicative stop-loss orders seen at: N/A).
US 30:
Weekly view: From the weekly angle, we can see that the buyers managed to maintain a position above the recently broken weekly resistance level 18098 last week, forcing price to close at 18262. For us personally, this move has convinced us that the buyers do want to take prices higher–It may not be this week, or even this month, but eventually this six-year-long up trend will likely continue in our opinion.
Daily view: The daily timeframe shows that the DOW closed above daily supply at 18207-18117 on Thursday, resulting in price testing the overall high 18279 on Friday. Ultimately, we believe price will break above 18279 sometime soon, but before it does this, we need to be prepared for the possibility that price may not react off of the recently broken daily supply area as demand, and sell off down to test daily demand seen at 18030-18161.
4hr view: Much the same as what we’re seeing on the daily timeframe at the moment, price closed above the 4hr resistance barrier at 18207-18125 on Thursday, and attacked 4hr supply seen at 18279-18250 on Friday. The only difference from the daily timeframe is that we can see temporary 4hr support formed at 18229, which managed to support the market during Friday’s sessions.
Provided that the buyers can maintain a strong line of defense around 18229 today, we could possibly see price close above the aforementioned 4hr supply area, which, as far as we can see, is the only obstacle now standing in the way of the monstrous weekly uptrend continuing.
Granted, there have been further developments on this index, but still not enough for us to consider a position just yet. Therefore, remaining flat until more conducive price action presents itself is the route we have chosen to take.

Levels to watch/live orders:
- Buys: Flat (Predicative stop-loss orders seen at: N/A).
- Sells: Flat (Predicative stop-loss orders seen at: N/A).
XAU/USD (Gold)
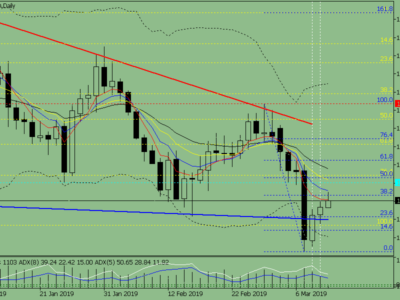
Weekly view: From a weekly standpoint, the trend on Gold is still firmly south, and will remain that way in our opinion until price closes above the weekly trendline resistance extended from the high 1488.0. At the time of writing, however, we can see that the bulls were clearly on form last week, consequently forcing price to close (1224.2) the week above weekly supply seen at 1223.1-1202.6. Assuming that the buyers can continue with this tempo into this week, it’s likely we may see price shake hands with the weekly trendline resistance just mentioned above.
Daily view: The daily timeframe shows that the recent surge of buying commenced from daily support seen at 1178.3. The move from here aggressively took out the daily supply area coming in at 1215.0-1204.5, and continued north to test a fresh daily supply area positioned at 1236.6-1226.9. The reaction from this daily supply zone suggests to us that the sellers have no interest in taking things lower at this time. It will be interesting to see what the 4hr scale has to report…
4hr view: Thursday’s sessions saw price rebound from a minor 4hr swap level coming in at 1212.7, and eventually spike above a 4hr supply area seen at 1225.2-1220.5 which has held firm on several occasions since the 17th February 2015. This move above this zone likely triggered in a ton of buy stops from traders both trying to fade this 4hr supply zone and also buy the breakout. Going into Friday, specifically the London session, price sold off and once again rebounded from the 4hr swap level at 1212.7. It was only once the U.S traders arrived at their desks did we see a push higher up to the extremes of the recently pierced 4hr supply area.
With all of the above taken into account, here is how we see today and possibly the rest of the week’s action playing out… The stops taken from above the 4hr supply area at 1225.2-1220.5 has likely paved the way north for an attack of 4hr supply seen at 1236.6-1230.6 (located deep within the daily supply area mentioned above at 1236.6-1226.9).
For us to take advantage of this potential move north, however, price would need to sell off and touch gloves with the green buy zone seen at 1216.3/1210.9 as per the red arrows. Supporting a trade long from here is the recent higher-timeframe weekly close above weekly supply, but against us is potential downward pressure from the current daily supply area just mentioned (see above for levels).
The risk/reward from this green area to the upper 4hr supply area at 1236.6-1230.6 is quite good. If we bought at current prices though, that risk/reward ratio drops considerably, hence the reason why we need to wait for a market sell off. Assuming that price reaches our green buy zone sometime this week before hitting our target 4hr supply, one could, if they so wished simply place a pending buy order at the top-side of our green area around 1216.7 area, with a stop set below at 1210.3. Nonetheless, if you’re conservative like us, you may choose to wait for the lower-timeframe buyers to establish support within this higher-timeframe zone before jumping in.

Levels to watch/live orders:
- Buys:1216.3/1210.9 [Tentative – confirmation required] (Predicative stop-loss orders seen at: 1210.3).
- Sells: Flat (Predicative stop-loss orders seen at: N/A).
The post Monday 18th May: Weekly technical outlook and review appeared first on .
Source:: Monday 18th May: Weekly technical outlook and review