
Previous Story
Monday 27th October: Weekly technical outlook and review
Posted On 27 Oct 2014
Comment: 0
EUR/USD:
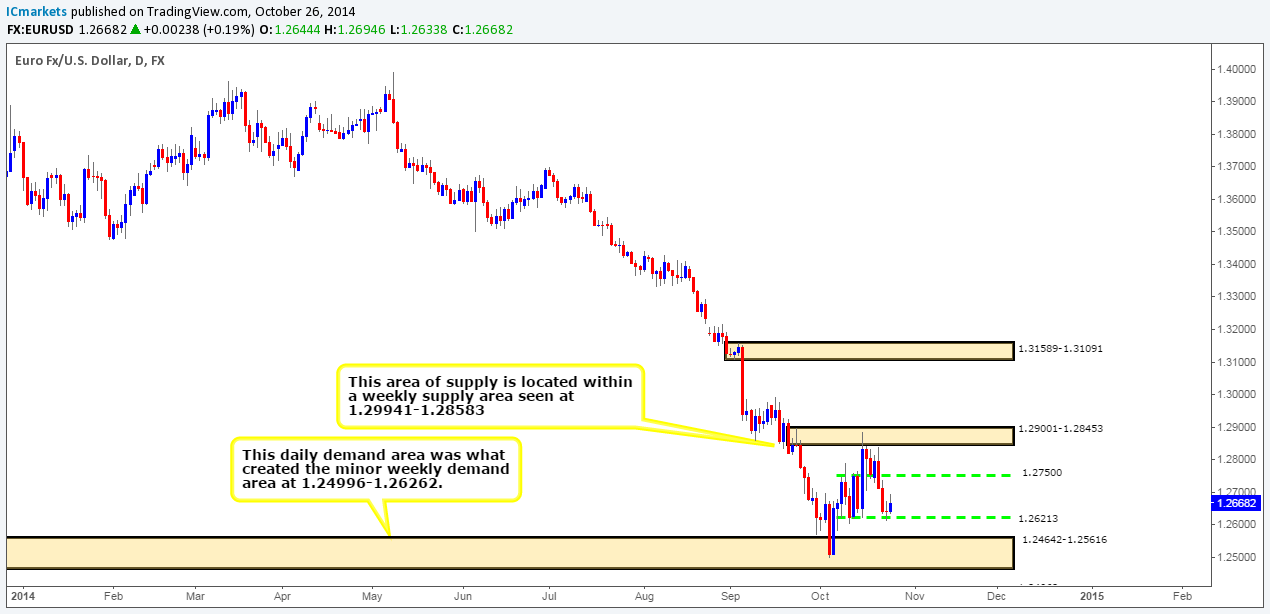
Weekly Timeframe: The weekly timeframe shows that for the past three weeks price was unable to significantly close above 1.27541. However, the week before last saw price spike into a nice-looking weekly supply area just above at 1.29941-1.28583, where there were clearly active sellers waiting. As a consequence this saw price move further south down to a minor weekly demand area coming in at 1.24996-1.26262.

Daily Timeframe: Over the past few weeks the market has found temporary support around 1.26213, if a close below this level is seen, it’s very likely price will be forced to hit a daily demand area coming in at 1.24642-1.25616. However, in the event that buying interest comes into the market here, the first trouble area for the buyers would very likely be around the 1.27500 area.
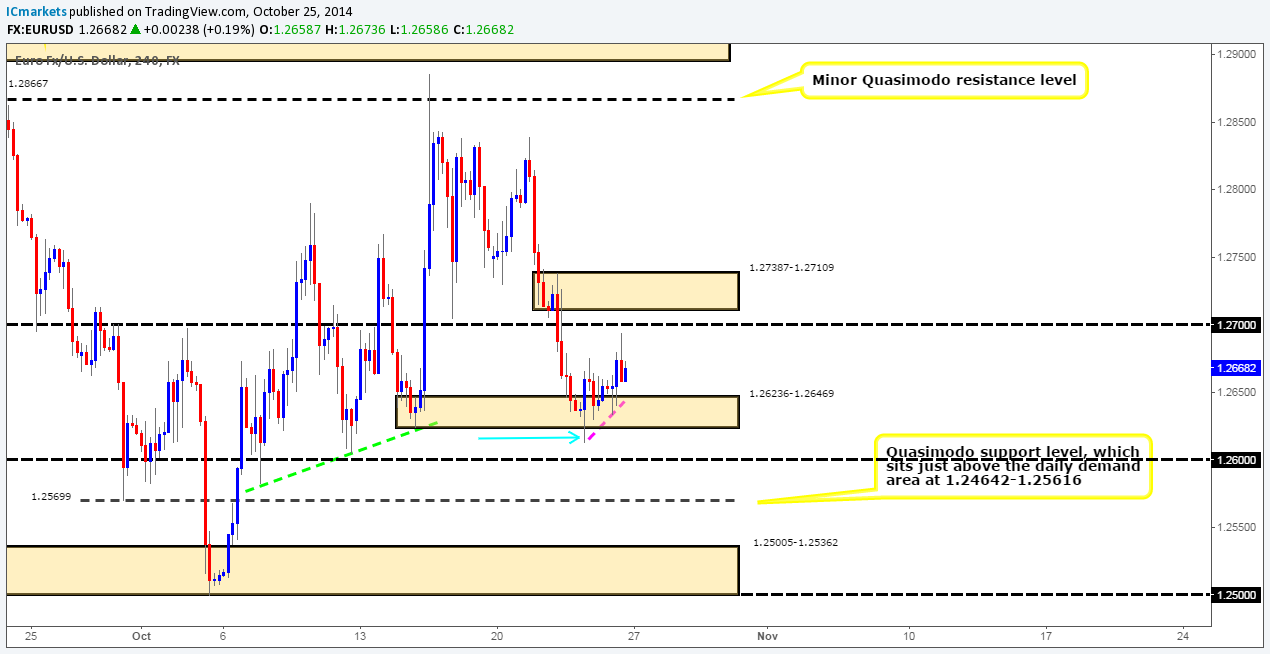
4hr Timeframe: As already mentioned in the previous analysis, the 4hr demand area at 1.26236-1.26469 has very likely already been consumed (blue arrow – 1.26125). Below this area – other than the 1.26 level, most of the demand to the left has also likely been consumed as well (check out the demand consumption tails around the green trend line), which leaves the path south clear down to around a 4hr Quasimodo support level seen at 1.25699 (active buy orders are seen just above at 1.25744).
However, late on Friday price attempted to trade up to the 1.27 level (1.26946), which was also reported may happen if the big boys did not have enough liquidity to sell into the market. What was interesting though was how price approached this round-number level. Notice any similarities between the green trend line and the pink trendline? The pink trendline appears to be doing much the same as the green trendline – consuming buy orders as price rallies higher, which again likely clears the path south for future selling.
From just looking at the 4hr timeframe it appears we are very likely going to be seeing some selling action sometime this week, be it from the round number 1.27 (tentative sell orders are seen just below at 1.26972), or even the 4hr decision-point supply area just above it at 1.27387-1.27109 (tentative sell orders are seen just below at 1.27098).
Nonetheless, we mustn’t forget that price is currently trading around both a minor weekly demand area (1.24996-1.26262), and also a small daily support level (1.26213) at the moment. So, with this in mind, assuming one does consider selling this market, he/she will need to monitor the trade carefully, as buying could come into the market at anytime.
Buy/sell levels:
- Buy orders: 1.25744 (Predicative stop-loss orders seen at: 1.25593).
- Sell orders: 1.26972 (Predicative stop-loss orders seen at: 1.27431) 1.27098 (Predicative stop-loss orders seen at: 1.27431).
GBP/USD:
Weekly Timeframe: For the past few weeks price has been trading around a weekly demand area coming in at 1.58533-1.60157. There has been some buying interest seen here, but nothing to get excited about. A break below here would likely attract further selling down to a weekly resistance flip level seen at 1.57166.
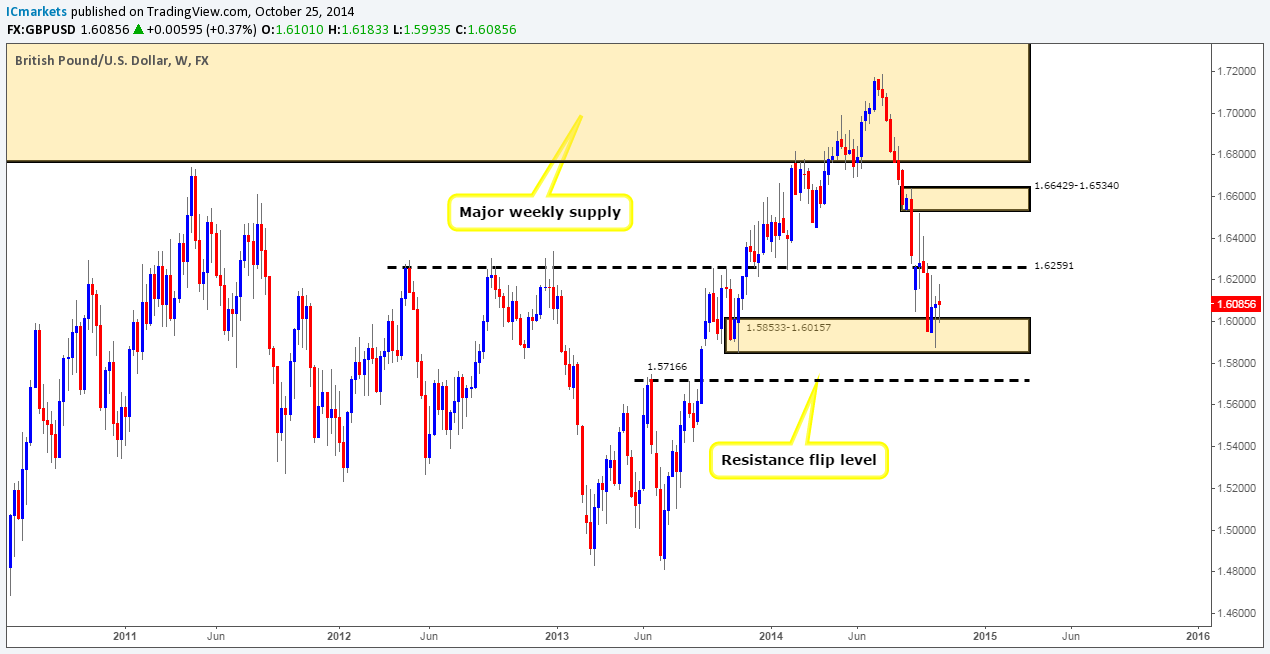
Daily Timeframe: The daily timeframe shows just why the buying interest on the weekly timeframe is not anything to get excited about. Price has been trading between a minor daily support flip level at 1.61609 and a combined daily demand/Quasimodo support area at 1.58533-1.59914/1.58934 since the 03/10/2014. It is only until one of these areas sees a positive close; we will then have some idea on future direction.

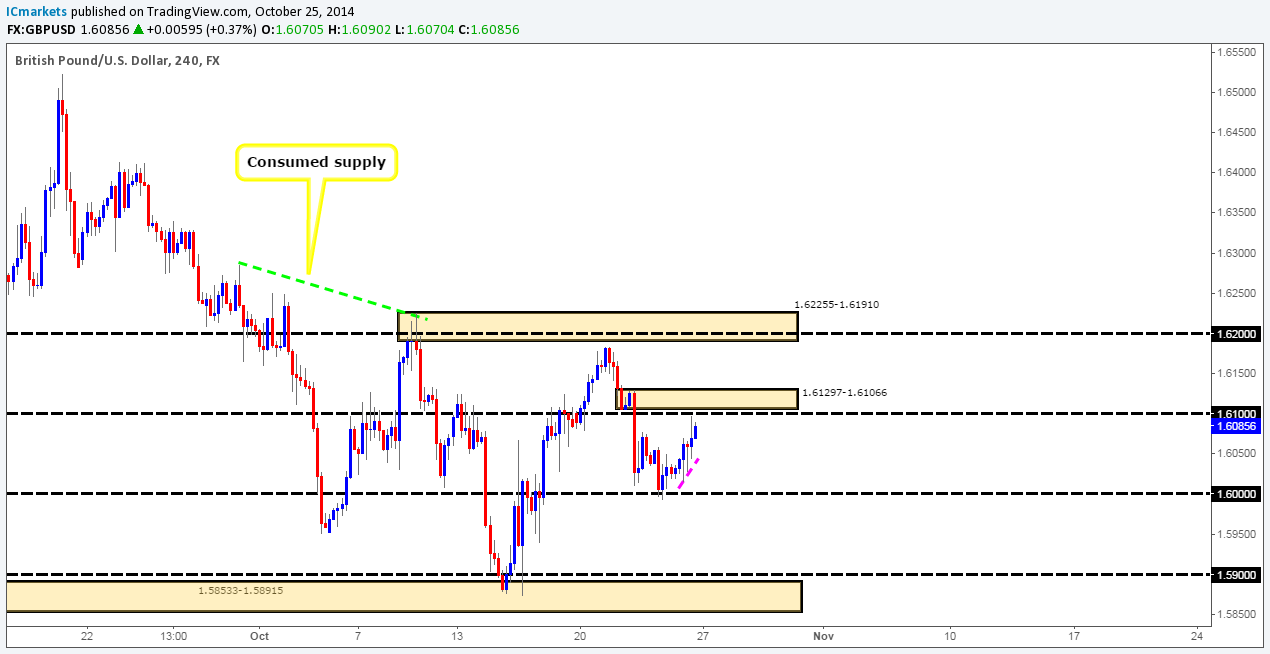
4hr Timeframe: The 4hr timeframe shows that price extended higher from Thursday’s reaction around 1.6, fuelling further buying up to just below the 1.61 level (1.60975). Can you see any similarities to the Euro here? We certainly can! Check out the way in which price approached the 1.61 level; there were very obvious buying tails present here (1.60158/1.60280/1.60447). These tails are very likely consuming buy orders as price rallies higher which as a result likely clears the path south for future selling.
So, with the above taken into consideration, and the weekly timeframe showing little buying interest around the weekly demand area mentioned above at 1.58533-1.60157, we feel there is a good chance selling will be seen early on in the week back down to the 1.6 level. Could we enter on this possible down move? Well, the only way in our opinion would be if price were to rally up to either the 1.61 level, as active sell orders are likely lurking just below at 1.60979, or even just above there towards a 4hr decision-point supply area coming in at 1.61297-1.61066, where once again there are likely active sell orders seen just below at 1.61049.
Buy/sell levels:
- Buy orders: N/A (Predicative stop-loss orders seen at: N/A).
- Sell orders: 1.60979 (Predicative stop-loss orders seen at: 1.61329) 1.61049 (Predicative stop-loss orders seen at: 1.61329).
AUD/USD:
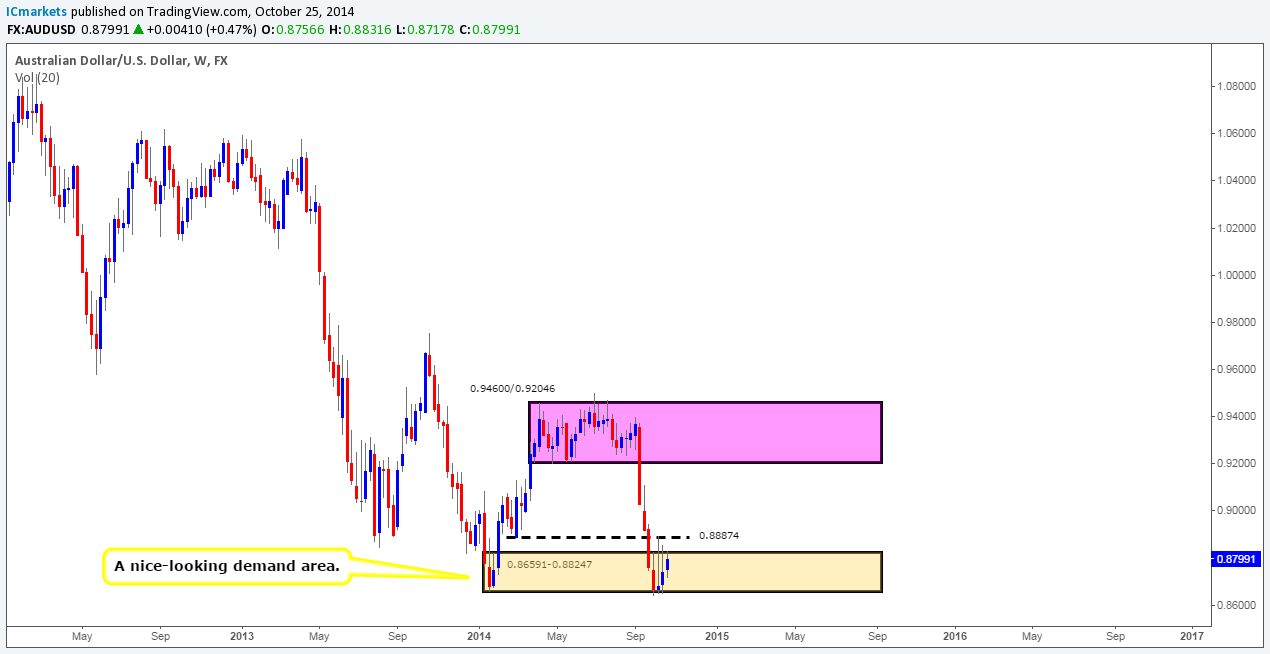
Weekly Timeframe: In our opinion the weekly timeframe is still depicting buying weakness out of a weekly demand area coming in at 0.86591-0.88247. If price on the other hand had broken above last week’s high (0.88591), then it may have been a different story.
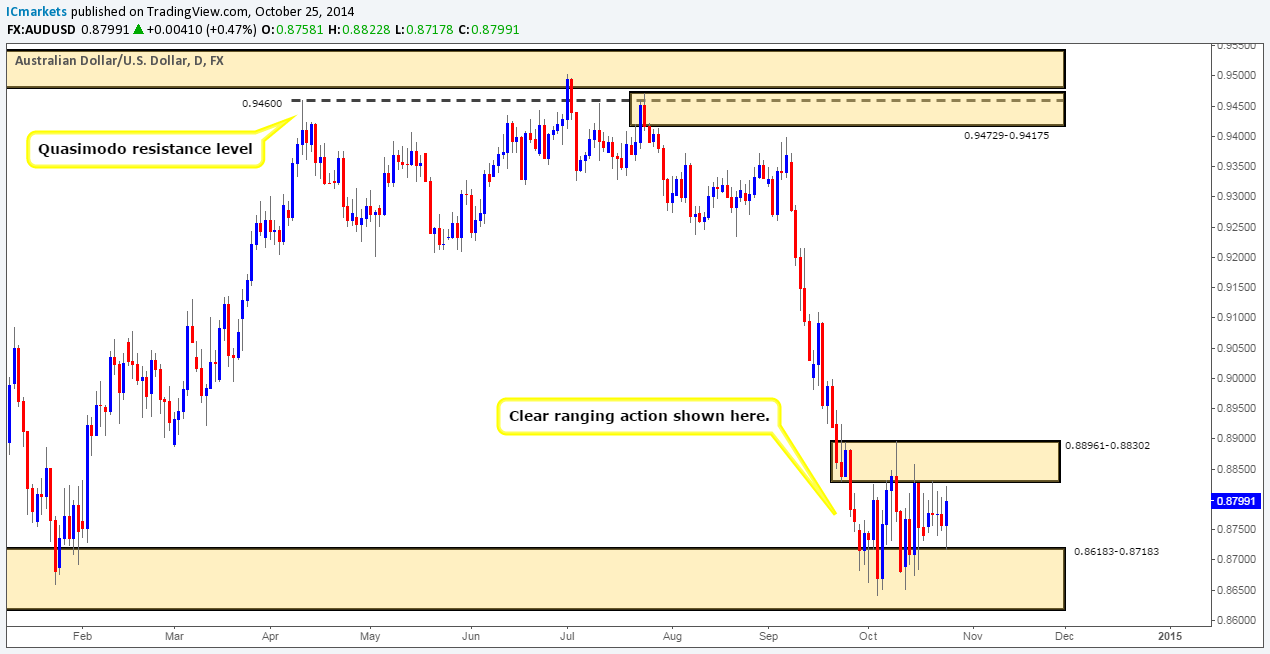
Daily Timeframe: The daily timeframe remains to be indecisive, as price is still seen trading between a daily demand area at 0.86183-0.87183, and a daily decision-point supply area coming in at 0.88961-0.88302. In our opinion, there is no clear direction on this timeframe until either one of these areas sees a break. Therefore, going long within the aforementioned weekly demand area may not be the best path to take until the daily decision-point supply area mentioned above is consumed.
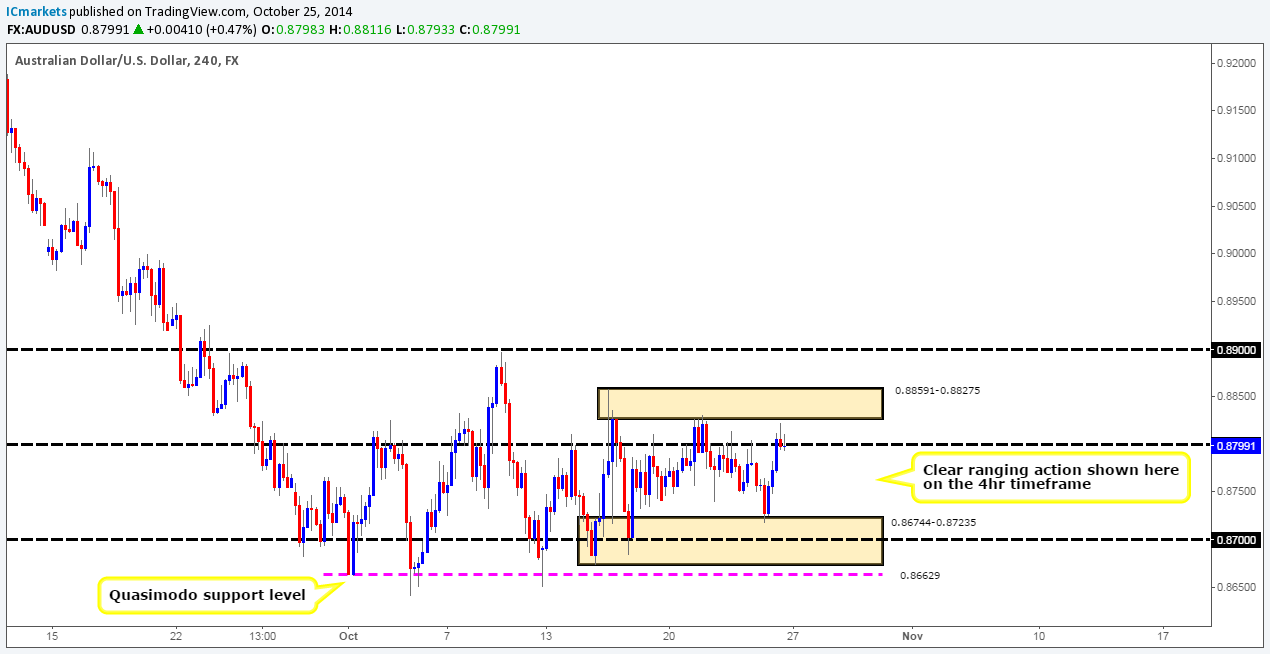
4hr Timeframe: Last week the AUS/USD stagnated with no real direction being seen all week. Price remains consolidating between a 4hr supply area seen at 0.88591-0.88275 (tentative sell orders are seen just below at 0.88250), and a combined 4hr demand/round number area at 0.86744-0.87235/0.87 (tentative buy orders are seen just above at 0.87297). This range has proved to be relatively stable considering the amount of times it has been tested, and as a result there are very likely opportunities to trade the extremes of this range. However, trading at the extremes puts us at risk of fakeouts, so we would only contemplate entering the market with corresponding lower-timeframe confirmation.
Buy/sell levels:
- Buy orders: 0.87297 – Tentative (Predicative stop-loss orders seen at: 0.86483).
- Sell orders: 0.88250 – Tentative (Predicative stop-loss orders seen at: 0.88657).
USD/JPY:
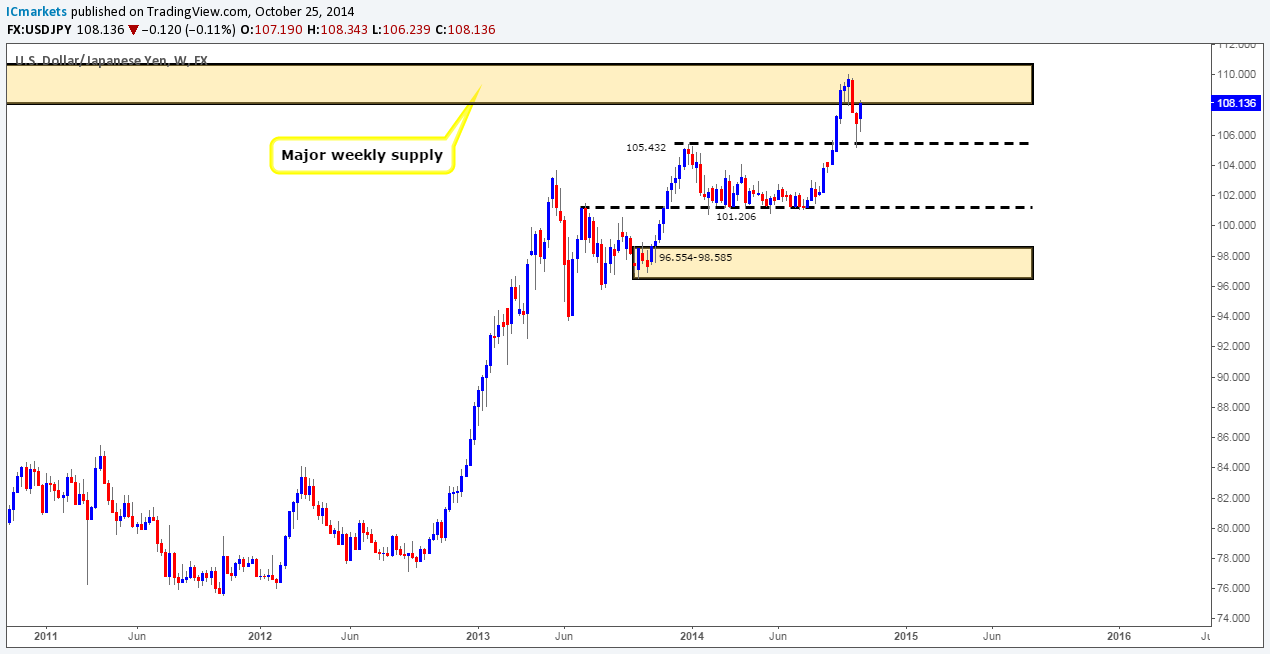
Weekly Timeframe: The week before last showed price reacting off of a weekly resistance flip level seen at 105.432, last week however saw further buying coming into the market, which pushed price back up to a major weekly supply area coming in at 110.652-108.123. Could this be pro money coming back to collect the last of the unfilled sell orders before a more aggressive sell off is seen?
Daily Timeframe: Thursday’s trading action saw price aggressively rally north towards a minor daily support flip level seen at 108.241. Minor selling interest was then seen around this level on Friday, which in our opinion was not very convincing. Could this be a subtle sign that price will likely continue north towards a major daily resistance flip level seen just above at 108.575 sometime during the week? Let’s see what we can find on the 4hr timeframe.
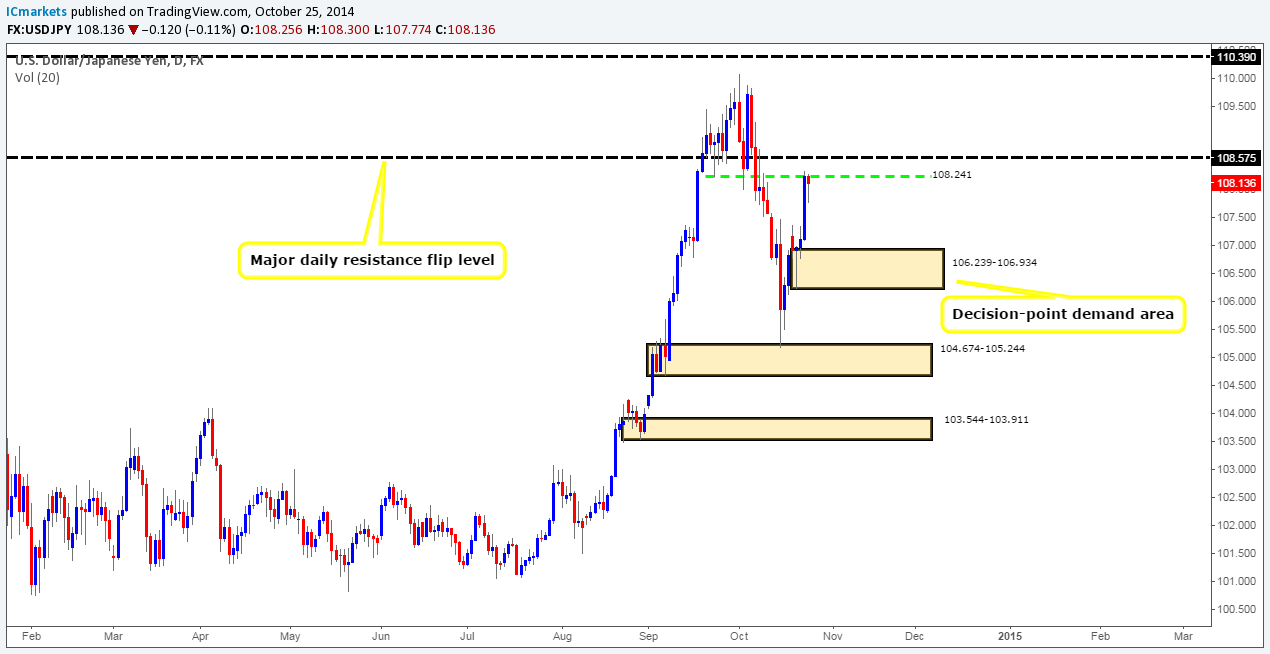
4hr Timeframe: The 108 level seems to be providing the market with temporary support at the moment as price closed the week just above at 108.136. Assuming the buyers can hold out above this level, we may see price test a small 4hr Quasimodo resistance level coming in just above at 108.524 (active sell orders are seen just below at 108.478), which is conveniently located just below the major daily resistance flip level mentioned above at 108.575.
Assuming a bearish reaction is seen around this Quasimodo level, and price is pushed below 108, we could possibly see this as being a fakeout above the minor daily support flip level mentioned already at 108.241 into the aforementioned major daily resistance flip level.

Buy/sell levels:
- Buy orders: N/A (Predicative stop-loss orders seen at: N/A).
- Sell orders: 108.478 (Predicative stop-loss orders seen at: 108.787).
EUR/GBP:
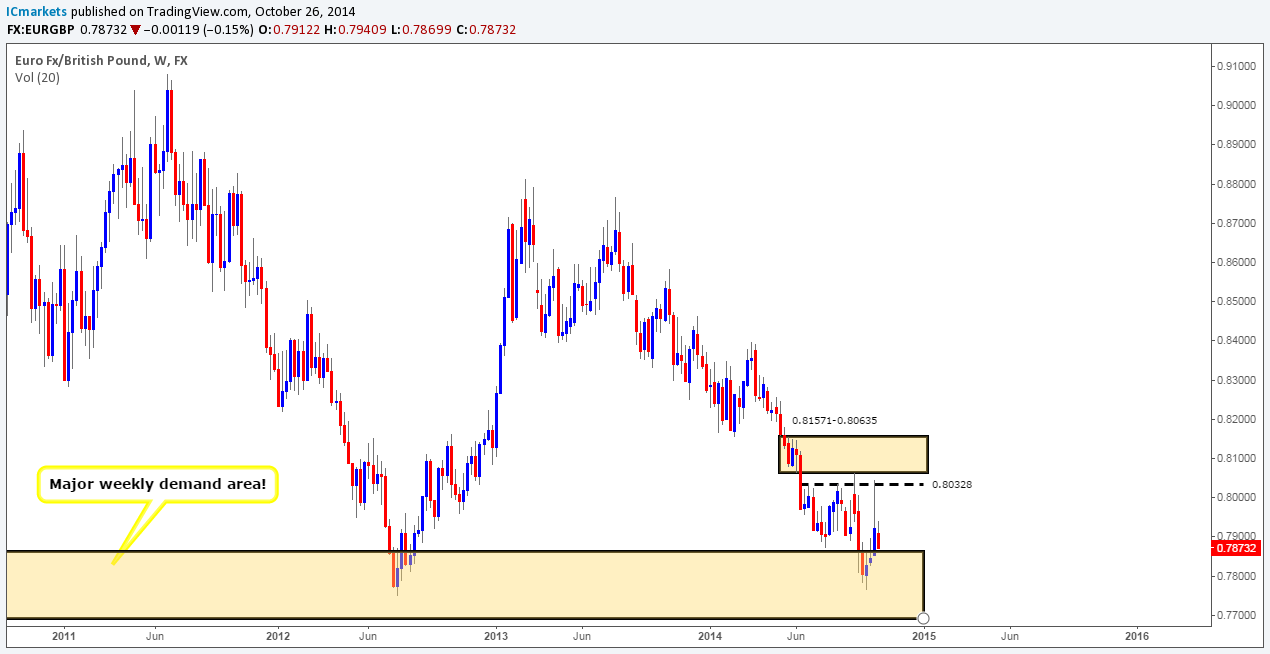
Weekly Timeframe: The market closed the week out just above a major weekly demand area (0.76931-0.78623) at 0.78732. Considering just the weekly timeframe for a moment, price has not exactly been showing much in the way of buying strength around this weekly demand zone. Could it be ‘game over’ for this demand area?
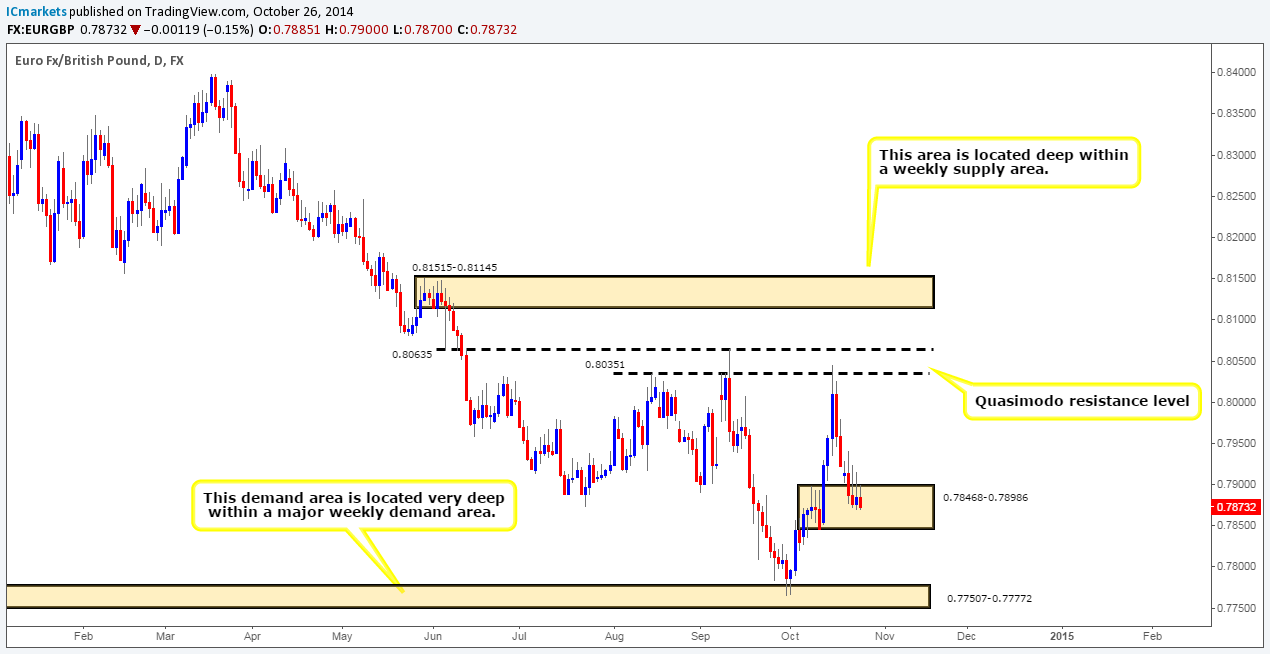
Daily Timeframe: The daily timeframe shows that price remains trading relatively deep within a daily decision-point demand area coming in at 0.78468-0.78986. Take a look at the three most recent daily candles seen within this area, together they show quite an impressive display of consecutive selling wicks. Does this mean price will likely see a sell off sometime this week? Let’s take a look at what the 4hr timeframes have to say.
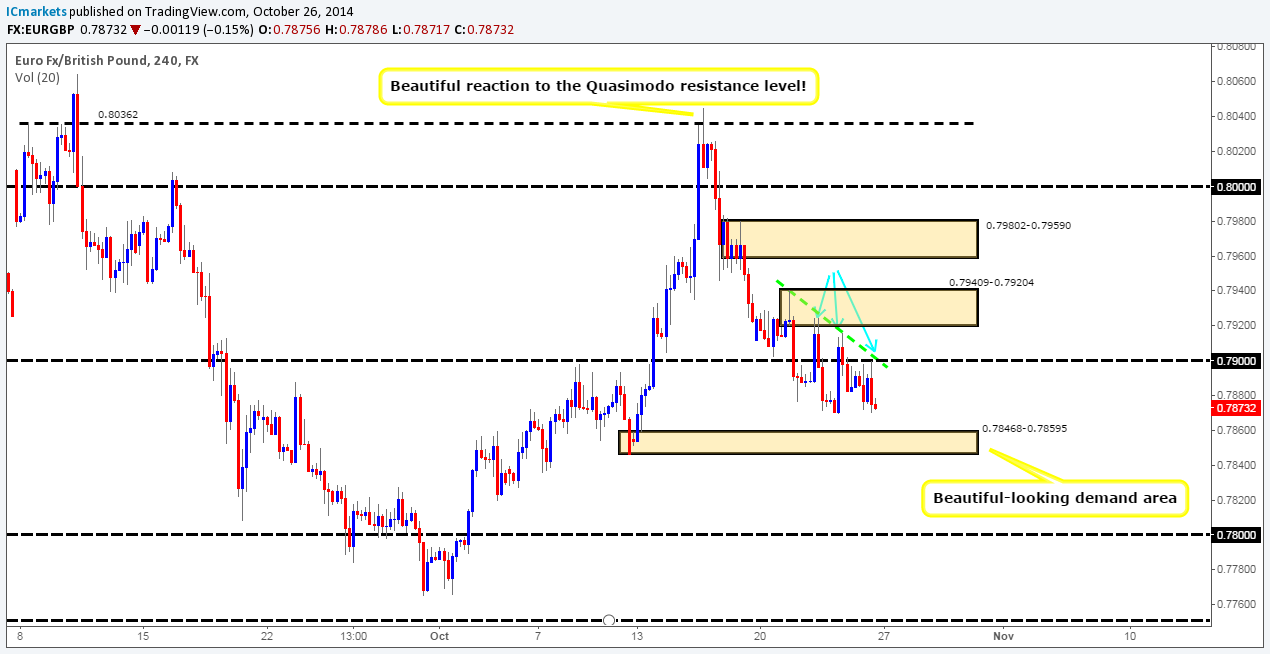
4hr Timeframe: The 4hr timeframe shows there is room for price to move south down to at least a fresh 4hr demand area seen at 0.78468-0.78595 (active buy orders are seen just above at 0.78616), which is conveniently located deep within the daily decision-point demand mentioned above at 0.78468-0.78986.
With the above taken into consideration, check out how price is approaching this 4hr demand area (green trendline). Price movement such as this is a very common when approaching very obvious supply or demand zones. However, this chart is particularly beautiful! Notice that each time price makes a lower low, we then see a return to collect any unfilled sell orders that may have been left behind (marked with blue arrows). This does two things, it allows pro money to keep pushing price south using the unfilled sell orders, but at the same time it also clears the path north for any future buying, which in our opinion is a perfect approach to a fresh demand area. Therefore, with the path likely clear north on the 4hr timeframe, and price currently trading around not only a weekly demand area, but also a daily decision-point demand area as well, it is very likely that if price reaches the aforementioned 4hr demand area, a nice rally north will be seen.
Buy/sell levels:
- Buy orders: 0.78616 (Predicative stop-loss orders seen at: 0.78444).
- Sell orders: N/A (Predicative stop-loss orders seen at: N/A).


