
Previous Story
Monday 28th July: Weekly Technical Outlook and Review
Posted On 28 Jul 2014
Comment: 0
For the readers’ benefit:
Price action confirmation: simply means traders will likely wait for price action to confirm a level by consuming an opposing supply or demand area, then entering a trade on a possible retracement, this may occur on the lower timeframes also.
Pending orders: means pending orders are likely seen.
EUR/USD:
Weekly TF.
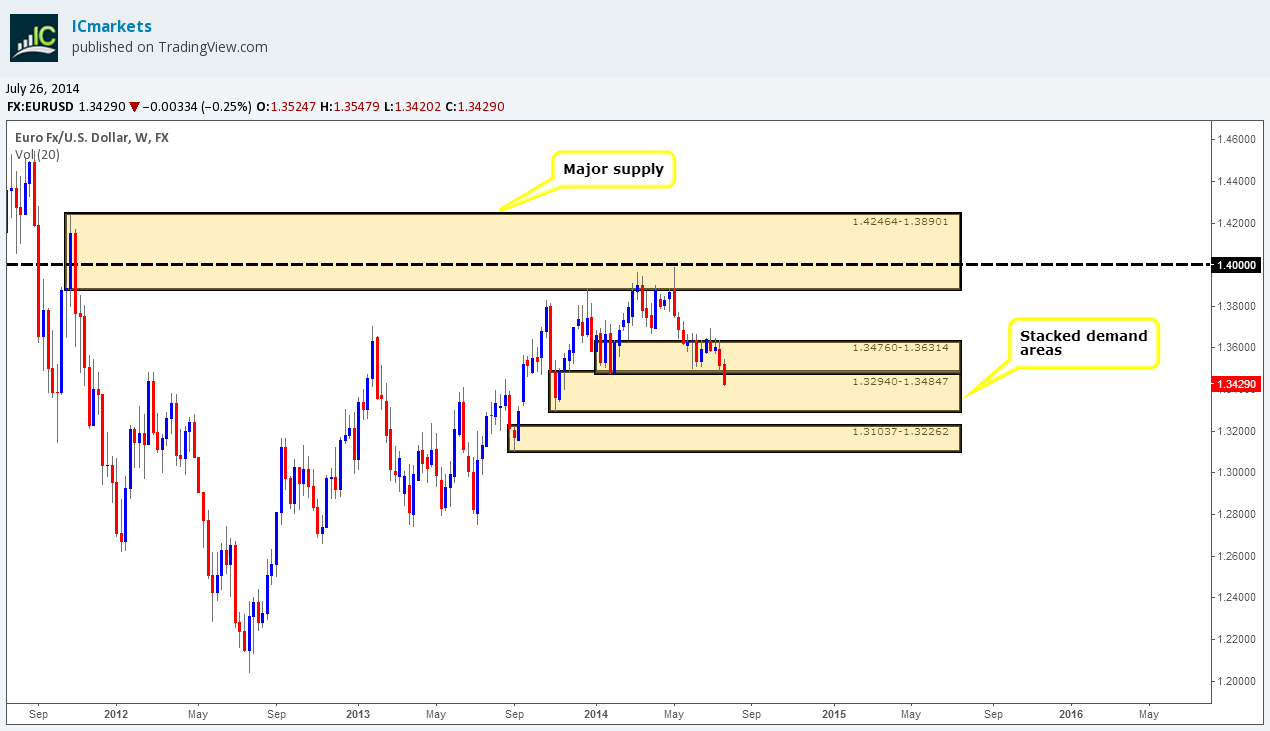
The weekly timeframe shows the sellers were undoubtedly in control for most last week. A hard full-bodied bearish candle was seen plummeting into the weekly demand area at 1.32940-1.34847. On this timeframe we could certainly see more selling before any buyers begin to show interest. We will be watching watching the 1.33660 level very carefully this week, as this is where buyers may likely be lurking. If this area does indeed see a break, there is very little we can see stopping price from hitting the third and final weekly demand area (stacked demand) at 1.31037-1.32262.
Daily TF.
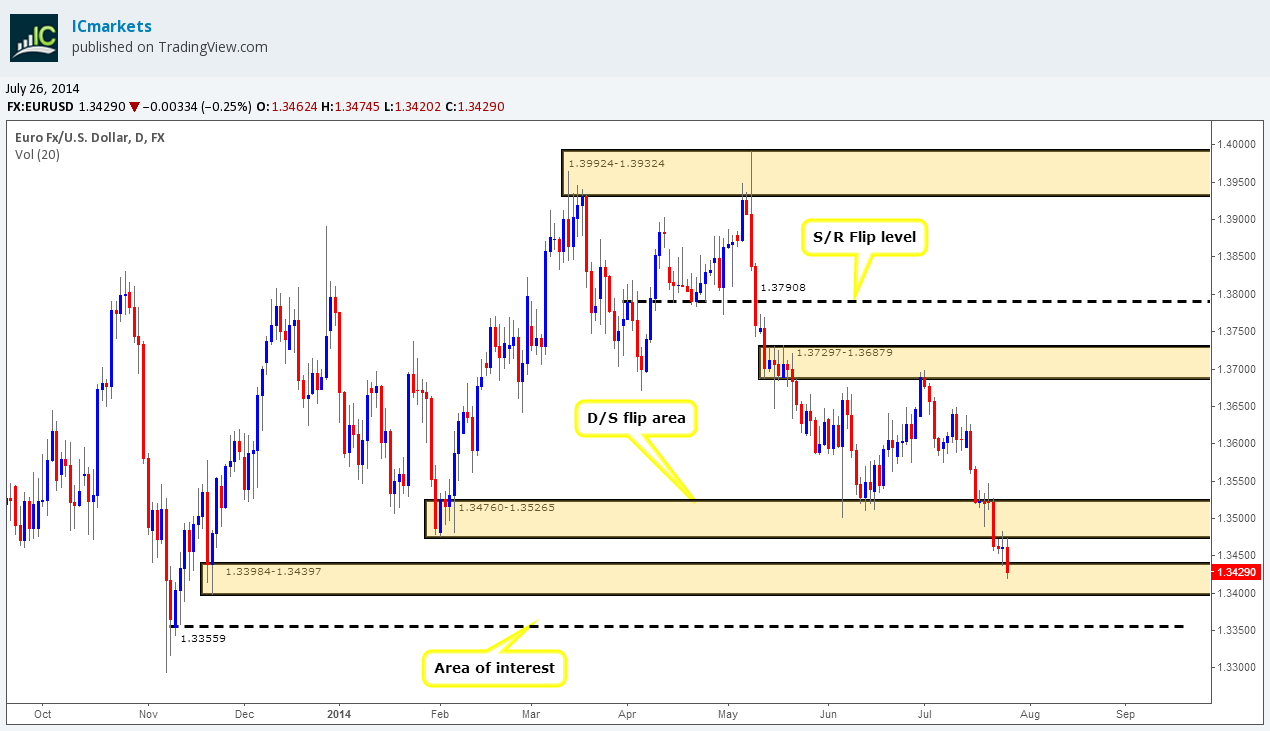
It was reported in Friday’s analysis a test of daily demand at 1.33984-1.34397 was seen. Price had traded between the aforementioned area and the previous daily demand which is now a D/S flip area at 1.34760-1.35265. If we see a break south of the daily demand area (levels above), prices may be forced to test our area of interest below at 1.33559.
4hr TF.
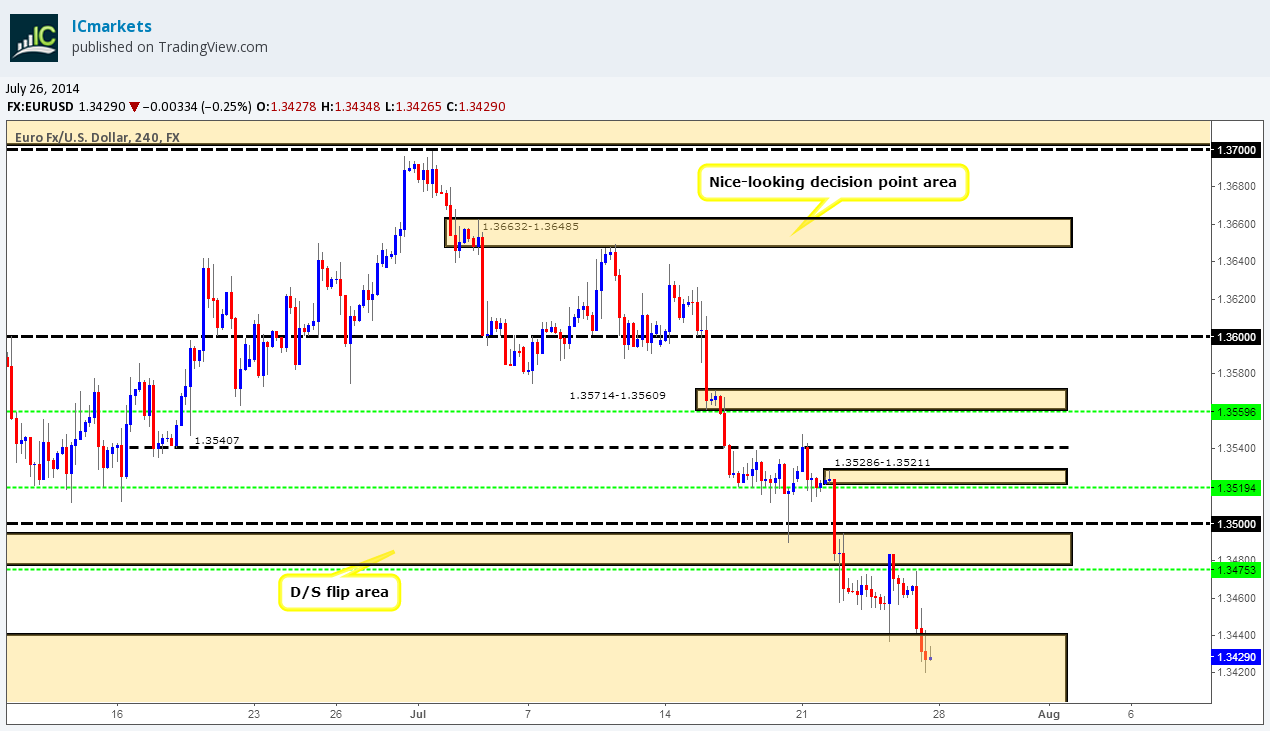
Granted we are in higher-timeframe demand (Weekly: 1.32940-1.34847 Daily: 1.33984-1.34397), but it appears at the time of writing the buyers are showing very little interest. On the 4hr timeframe, if we see a break below the 4hr demand area at 1.33984-1.34404 and the round number 1.34, price could drop, and drop hard. Take a look to the far left under the aforementioned 4hr demand area, we see consumed demand, the spikes down were no doubt sent to consume buyers on the initial rally north, and this means the path south is now very likely clear.
The only area we can see that has likely fresh buy orders waiting is around 4hr demand below at 1.31037-1.31278. Remember our higher-timeframe analysis? This small 4hr demand area is located in a whopping weekly demand area at 1.31037-1.32262 and also within daily demand at 1.31037-1.31755, so do note this 4hr demand area down, as we may see a huge bullish reaction here sometime soon.
Pending/P.A confirmation orders:
- The pending buy order (Green line) set just above demand (1.33984-1.34404) at 1.34434 was active, our first take-profit level was hit at 1.34760, and we closed the trade. The reasons for this are because it was late Friday, and price has yet got room to drop even more, so it was just not worth the risk.
- No P.A confirmation buy orders (Red line) are seen in the current market environment.
- The pending sell order (Green line) set just below the 4hr decision-point area (1.35714-1.35609) at 1.35596 has been removed. For the time being price has dropped too far from the entry level.
- Pending sell orders (Green line) are seen just below a decision-point area (1.35286-1.35211) at 1.35194, as we believe this area to be good for a bounce at the very least, notice how this was the area pro money sellers likely made the decision to break the round number 1.35000, meaning there may very well be unfilled sell orders still there.
- New pending sell orders (Green line) are seen just below the D/S flip area (1.34760-1.34943) at 1.34753.The reasoning behind setting a pending sell order here was because this is the area we believe on this timeframe pro money sellers made the decision to push prices south into 4hr demand at 1.33984-1.34404, meaning there may well be unfilled sell orders still lurking there.
- No P.A confirmation sell orders (Red line) are seen in the current market environment.
Quick Recap:
The weekly timeframe shows the sellers have pushed price deep into weekly demand at 1.32940-1.34847, while on the daily timeframe, the sellers made a convincing push into daily demand at 1.33984-1.34397.If a break is seen of the 4hr demand area at 1.33984-1.34404, this could be the first signs of a big decline in the market to around 4hr demand below at 1.31037-1.31278.
- Areas to watch for buy orders: P.O: No pending buy orders are seen in the current market environment. P.A.C: No P.A confirmation buy orders are seen in the current market environment.
- Areas to watch for sell orders: P.O: 1.35194 (SL: 1.35319 TP: Dependent on price action approach) 1.35596 (SL: 1.35768 TP: Dependent on price approach) 1.34753 (SL: 1.35031 TP: Dependent on price approach). P.A.C: No P.A confirmation sell orders are seen in the current market environment.
GBP/USD:
Weekly TF.
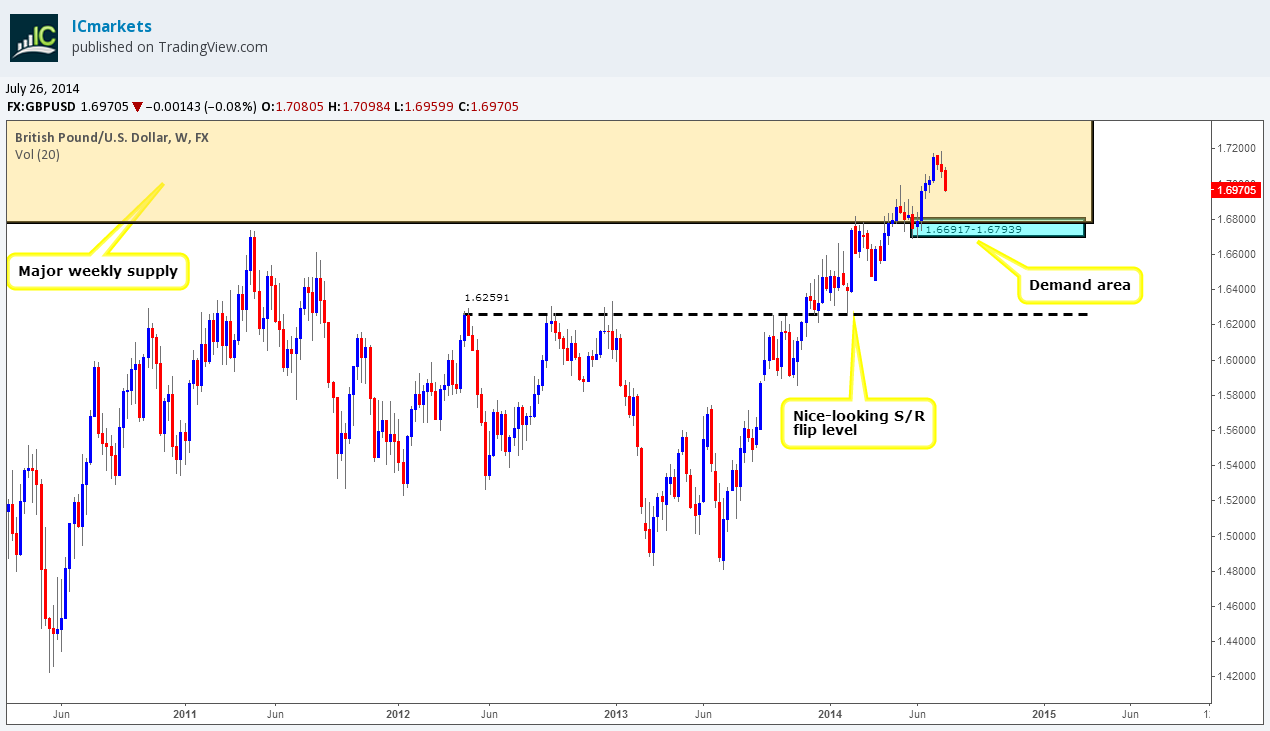
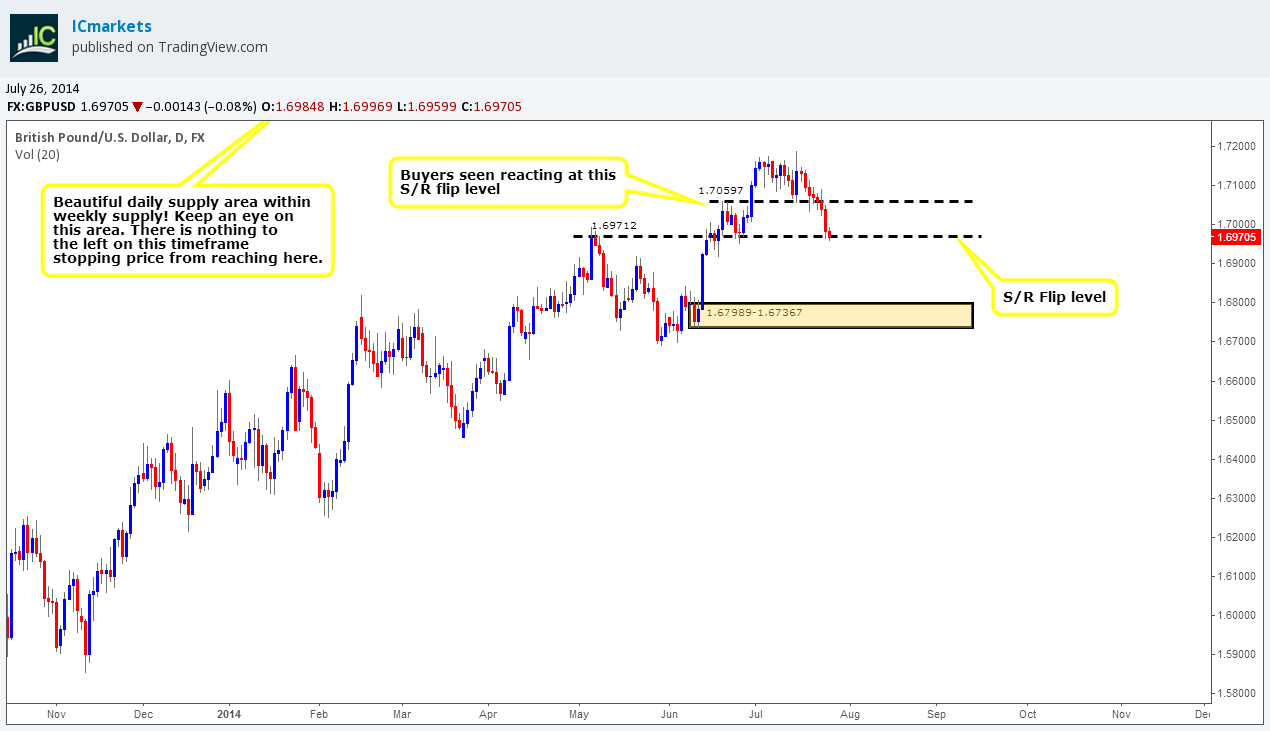
The sellers have begun to show some serious interest within weekly supply at 1.76297-1.67702, if this selling continues this week, we could very well be seeing price hit weekly demand below at 1.66917-1.67939.
Daily TF.
Last week, price closed at 1.69705 which is around a daily S/R flip level at 1.69712. If a bullish reaction is seen there, a move up to the previous daily S/R flip level at 1.70597 could well be seen. We favor a break south here due to what the weekly timeframe has told us. A break south could very well see prices dropping down to around the daily demand area at 1.67989-1.67367 where likely buy orders are waiting.
4hr TF.
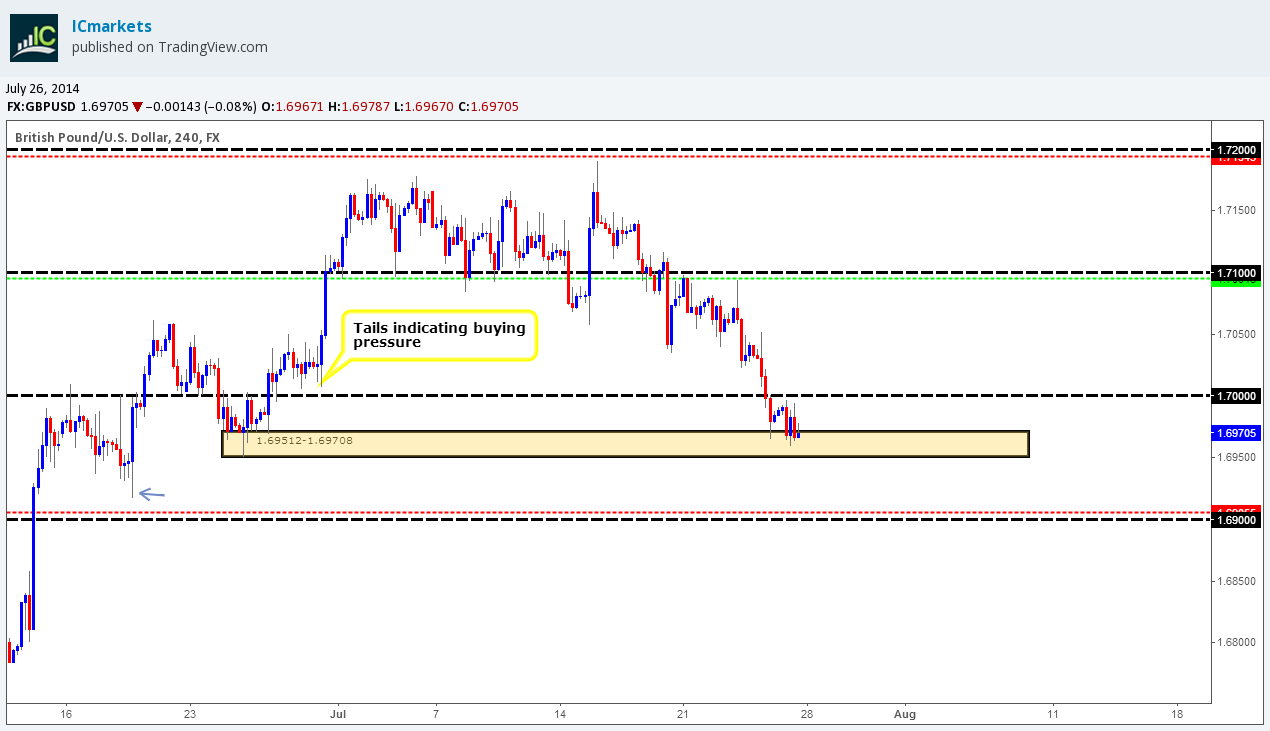
A drop below the round number 1.7 was seen last week; this no doubt upset millions of traders who were long around that area, including us!
A bullish reaction was seen around the 4hr demand area at 1.69512-1.69708, which consequently has trapped price between the aforementioned round number and this 4hr demand area. From the weekly timeframe, the sellers are on fire which could likely carry on this week, however on the daily timeframe we are now trading around a daily S/R flip level support at 1.69712 giving confluence to the aforementioned 4hr demand area.
If we a break lower, which is what we are favoring at the moment, a decline in price could be seen down to at least the round number 1.69. The reason for this is the tail marked with an arrow; this tail has likely consumed the majority of the buy orders around that area, thus possibly clearing the path for the sellers down to the round number level just mentioned.
Pending/P.A confirmation orders:
- The pending buy order (Green line) set just above the round number 1.70000 at 1.70058 has been stopped out.
- New P.A confirmation buy orders (Red line) are seen just above the round number 1.69000 at 1.69055. The reasoning behind setting this order is because we have no logical area on this timeframe for a stop-loss.
- New pending sell orders (Green line) are seen just below the round number 1.71000 at 1.70948. We have set a pending sell order here due to the fact we can place our stop just above the high 1.71167.
- P.A confirmation sell orders (Red line) are seen just below the round number 1.72000 at 1.71943. We have placed a P.A confirmation sell order here simply because these psychological levels are prone to deep tests/spikes, so sometimes it is better to wait for that all important confirmation.
Quick Recap:
Sellers seem to be on full steam on the weekly timeframe with little stopping them from reaching weekly demand at 1.66917-1.67939, while on the daily timeframe, price closed around the daily S/R flip level at 1.69712, buyers may react here, however we favor a break south. On the 4hr timeframe, we expect price to break below 4hr demand at 1.69512-1.69708, which could likely force price to test the round number below 1.69.
- Areas to watch for buy orders: P.O: No pending buy orders are seen in the current market environment. P.A.C: 1.69055 (SL: Dependent on price action after the level has been confirmed TP: Dependent on approaching price action after the level has been confirmed).
- Areas to watch for sell orders: P.O: 1.70948 (SL 1.71211 TP: Dependent on price approach). P.A.C: 1.71943 (SL: Dependent on price action after the level has been confirmed TP: Dependent on approaching price action after the level has been confirmed).
AUD/USD:
Weekly TF.
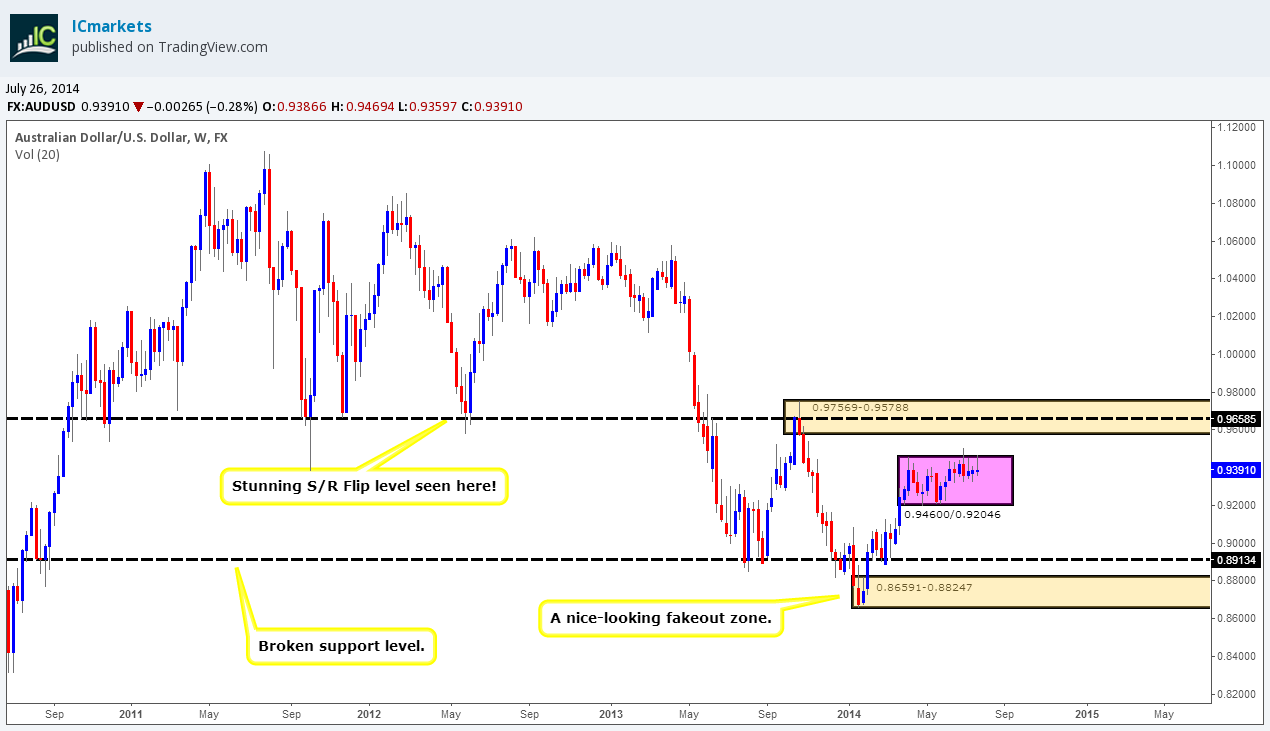
The weekly timeframe is still depicting consolidating price action with the upper limits being seen at 0.94600 and the lower at 0.92046; however price is now trading around the aforementioned upper limit at present, with the sellers seen rejecting off of the aforementioned upper limits, could we see a push to the downside within the range this week?
Daily TF.
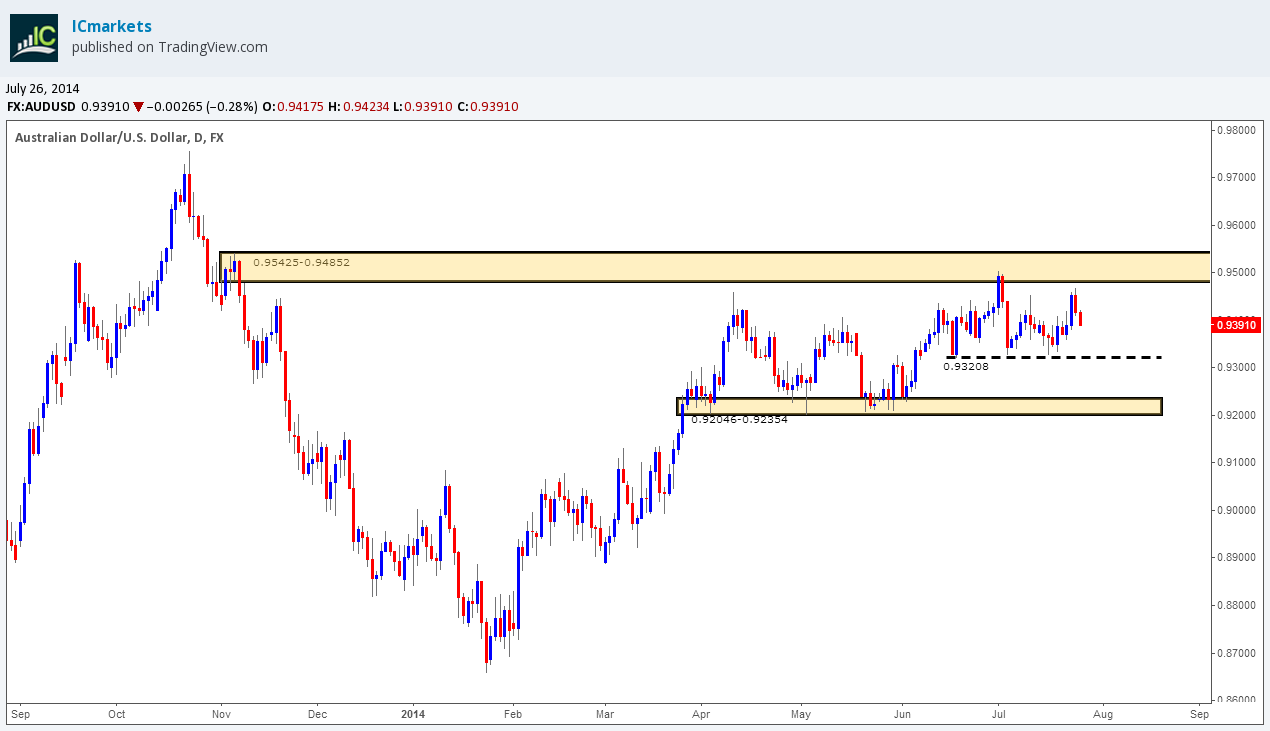
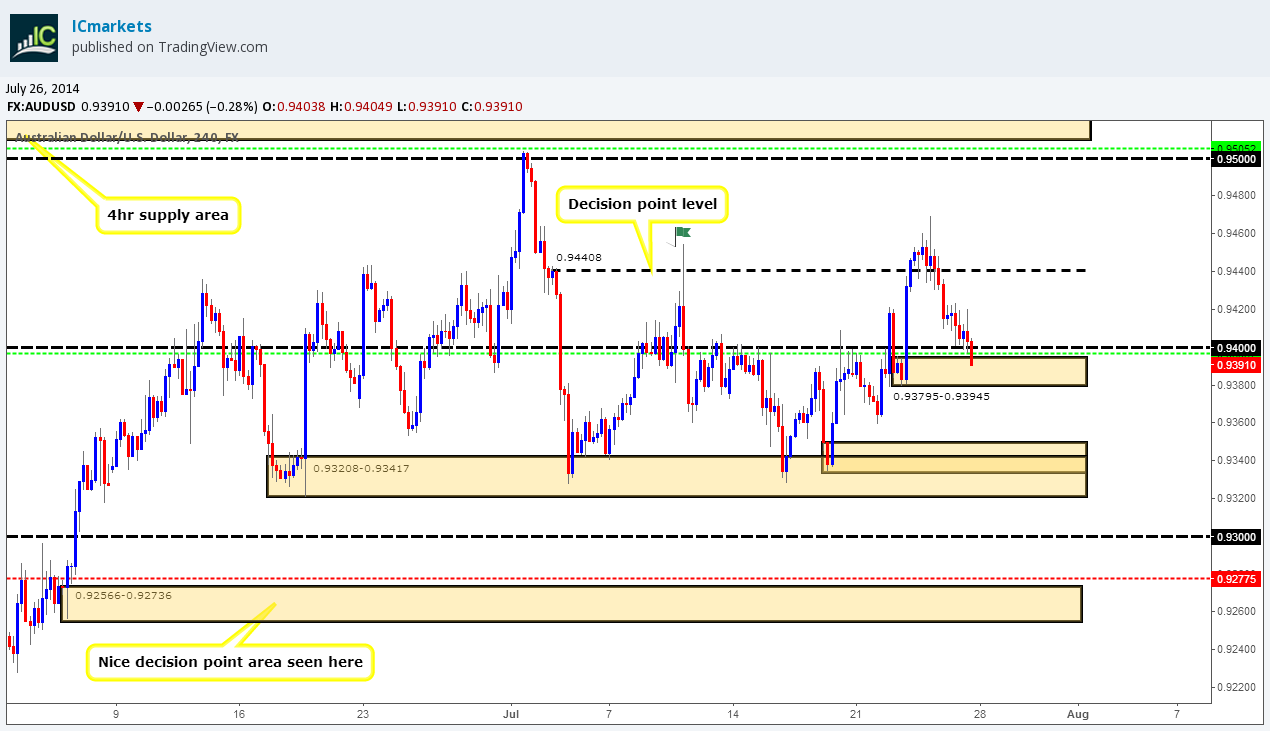
Buyers and sellers have been trading within a small range on the daily timeframe (daily supply being seen above at 0.95425-0.94852 and a low below at 0.93208). Once we see a break of either of these areas, we will likely have more idea on possible short-term direction.
4hr TF.
A close above the high marked with a green flag at 0.94550 was not seen last week. Instead, a decline in price happened down to a 4hr demand area at 0.93795-0.93945. This area remains important, as on this timeframe this is where pro money buyers likely made the decision to push price above the aforementioned high with the green flag, hence there may be unfilled buy orders lurking there.
Price has entered into the 4hr demand area just mentioned, and at the time of writing there has been very little interest shown by the buyers. We will be watching price action around the open very closely to see if the buyers give any subtle clues they intend to take prices higher, or indeed break lower.
Pending/P.A confirmation orders:
- The pending buy order (Green line) set just above a decision point area (0.93795-0.93945) at 0.93967 is now active, so do keep an eye out for a first take-profit level to be hit at 0.94408.
- P.A confirmation buy orders (Red line) are seen just above the decision point level (0.92566-0.92736) at 0.92775. The reason for placing a P.A confirmation buy order here rather than pending buy order is simply because we were trading just above a daily demand ‘buy zone’ at 0.92046-0.92354, meaning pro money could very well just ignore this level completely and trade deeper into the aforementioned daily demand area, so, confirmation is the order of the day!
- Pending sell orders (Green line) are seen just below supply (0.95425-0.95096) at 0.95052. A pending sell order is placed here due to this being an area where pro money was interested in before; see how close price came to the supply area? (Levels above), this indicates possible strong supply (selling pressure), so the next time price visits we can expect some sort of reaction.
- No P.A confirmation sell orders (Red line) are seen in the current market environment.
Quick Recap:
The weekly timeframe is still showing consolidating price action (0.94600/0.92046), while on the daily timeframe, price is still trading within a medium-term range (Daily supply: 0.95425-0.94852 Low: 0.93208). Our pending buy order set at 0.93967 was filled on the 4hr timeframe late Friday just above 4hr demand at 0.93795-0.93945. We will be watching the open very carefully regarding this long position, as at this point in time, no buying interest is currently being seen.
- Areas to watch for buy orders: P.O: 0.93967 (Active) (SL: 0.93773 TP: [1] 0.94408 [2] 0.95000).P.A.C: 0.92775 (SL: Dependent on price action after the level has been confirmed TP: Dependent on approaching price action after the level has been confirmed).
- Areas to watch for sell orders: P.O: 0.95052 (SL: 0.95467 TP: Depending on price approach)P.A.C: No P.A confirmation sell orders seen in the current market environment.
USD/JPY:
Weekly TF.
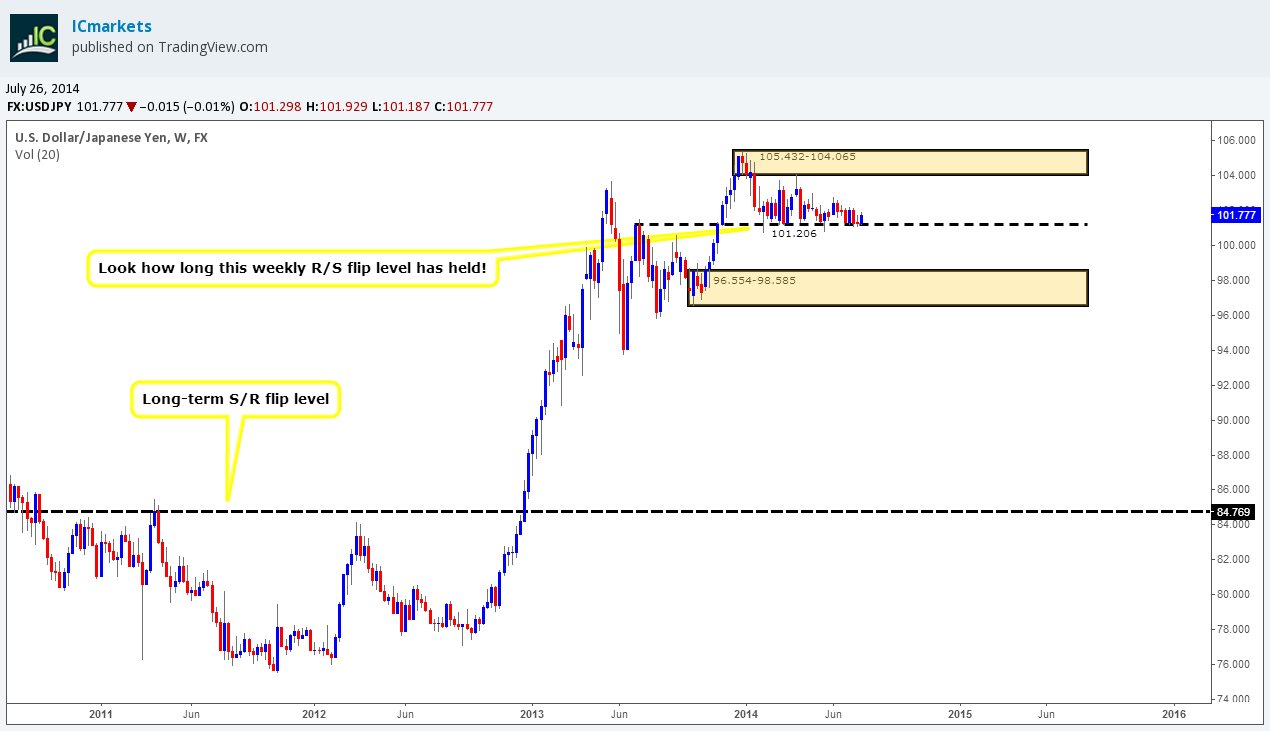
The weekly timeframe remains very much unchanged. Buying pressure is being seen from the long-term weekly R/S level at 101.206. Price has remained capped between the aforementioned weekly R/S level and the weekly supply area above at 105.432-104.065 since the 3rd of February 2014.
Daily TF.
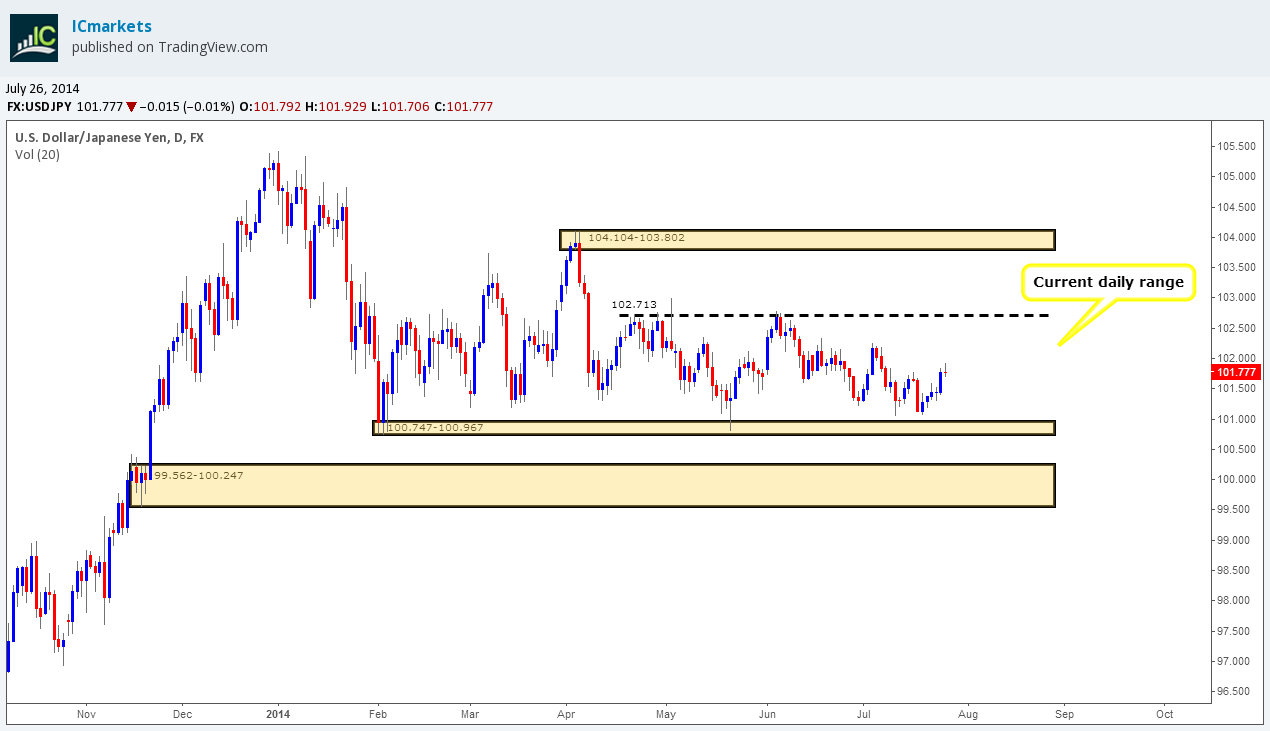
Buyers and sellers have been seen trading within a medium-term range now for about two months (Resistance: 102.713 Demand: 100.747-100.967) now. If we see a positive close below the aforementioned daily demand area, is this the end for the buyers? Not quite. A break below would likely see price trading down to daily demand at 99.562-100.247 where active buyers are quite possibly lurking. What would this look like on the weekly timeframe if we did indeed see a reaction at this daily demand area (99.562-100.247)? Our guess is it would look like a carefully-planned fakeout below the aforementioned weekly R/S level, which would no doubt give pro money lots of liquidity in the process.
4hr TF.
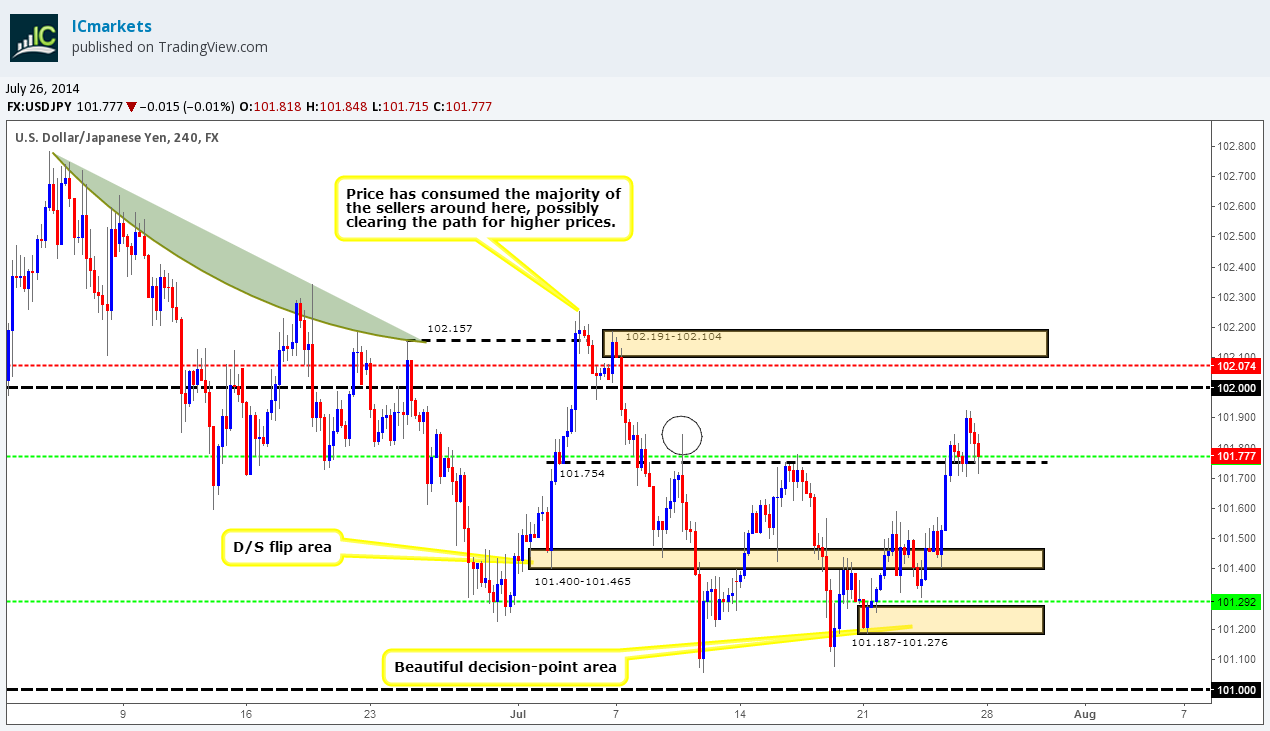
Price has broken above the high marked with a circle at 101.848, we then saw the opportunity to play the retest around the 4hr decision-point level at 101.754, our stop is very small, along with the risk.
If we see a positive close below the aforementioned 4hr decision-point level, there is very little to stop price from hitting the 4hr D/S flip area at 101.400-101.465, conversely, if we do see a push north from here, price will likely hit the round number 102.000 at the very least. We definitely favor the latter due to the current location of price on the weekly timeframe.
Pending/P.A confirmation orders:
- Pending buy orders (Green line) are seen just above the decision-point area (101.187-101.276) at 101.292. The reason a pending buy order has been set here is because this remains an important area as this is the likely where pro money buyers made the ‘decision’ to push prices higher above the D/S flip area at 101.400-101.465, making this zone a magnet for a first-time reaction.
- The pending buy order (Green line) set just above the decision-point level (101.754) at 101.772 is now active, so do keep an eye out for our first take-profit level set at 102.000 to be hit.
- No P.A confirmation buy orders (Red line) are seen in the current market environment.
- Pending sell orders (Green line) are seen just below supply (103.294-102.983) at 102.953. A pending sell order was set here due to this being an area where likely unfilled sell orders are.
- P.A confirmation sell orders (Red line) are seen just below supply (102-191-102.104) at 102.074. A P.A confirmation sell order was used here purely for the simple fact we are trading around a higher-timeframe weekly support level at 101.206 meaning we may see a small reaction, but nothing to write home about, hence the need for confirmation!
- The P.A confirmation sell order (Red line) set just below the decision-point level (101.754) at 101.733 has been cancelled, price blew straight through our level.
Quick Recap:
The weekly timeframe remains unchanged with price still seen trading around the long-term weekly R/S level at 101.206, while on the daily timeframe, the current daily range still remains unchanged (Daily resistance: 102.713 Daily demand: 100.747-100.967). A positive close above the high marked with a circle at 101.848 was seen and we quickly jumped in on the retest around the 4hr decision point-level (101.754), setting our pending buy order at 101.772 which was filled late Friday afternoon.
- Areas to watch for buy orders: P.O: 101.292 (SL: 101.166 TP: Dependent on price approach) 101.772 (SL: 101.686 TP: 102.000 P.A.C: No P.A confirmation buy orders are seen in the current market environment.
- Areas to watch for sell orders: P.O: 102.953 (SL: 103.317 TP: Dependent on price approach)P.A.C: 102.074 (SL: likely will be set at 102.214 TP: Dependent on approaching price action after the level has been confirmed).
EUR/GBP:
Weekly TF.
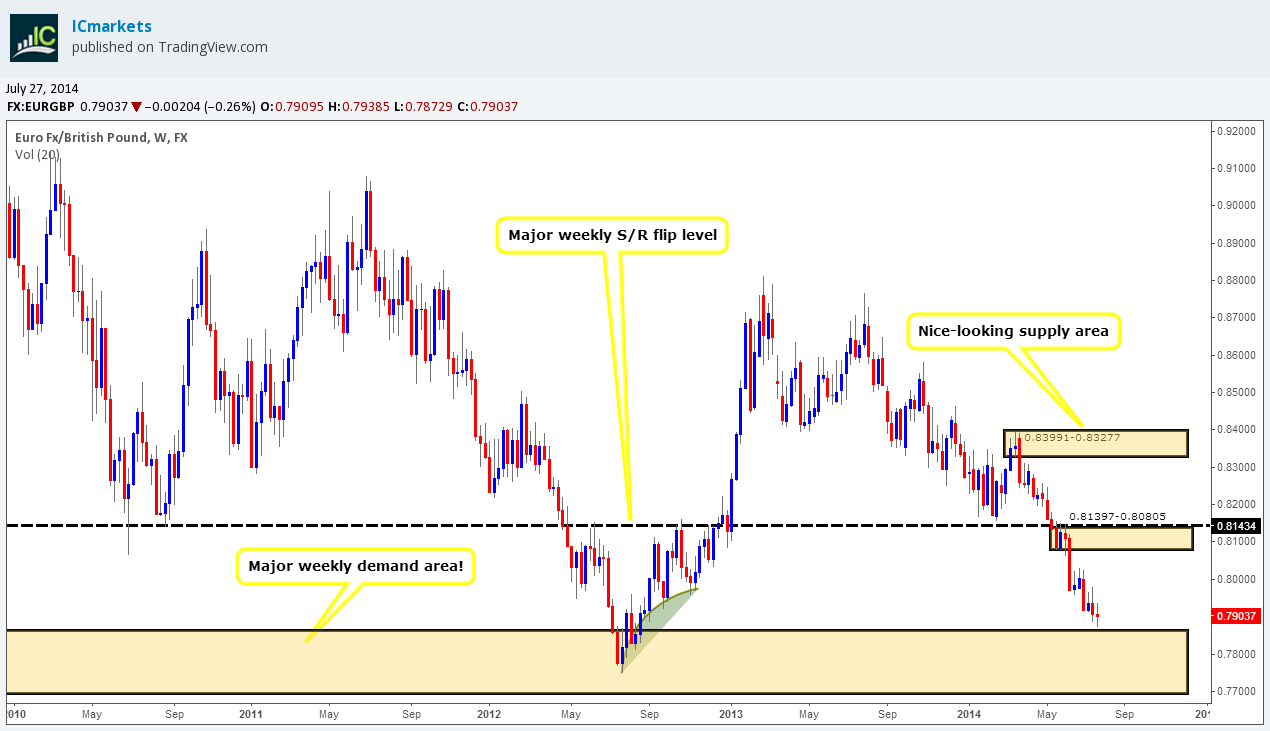
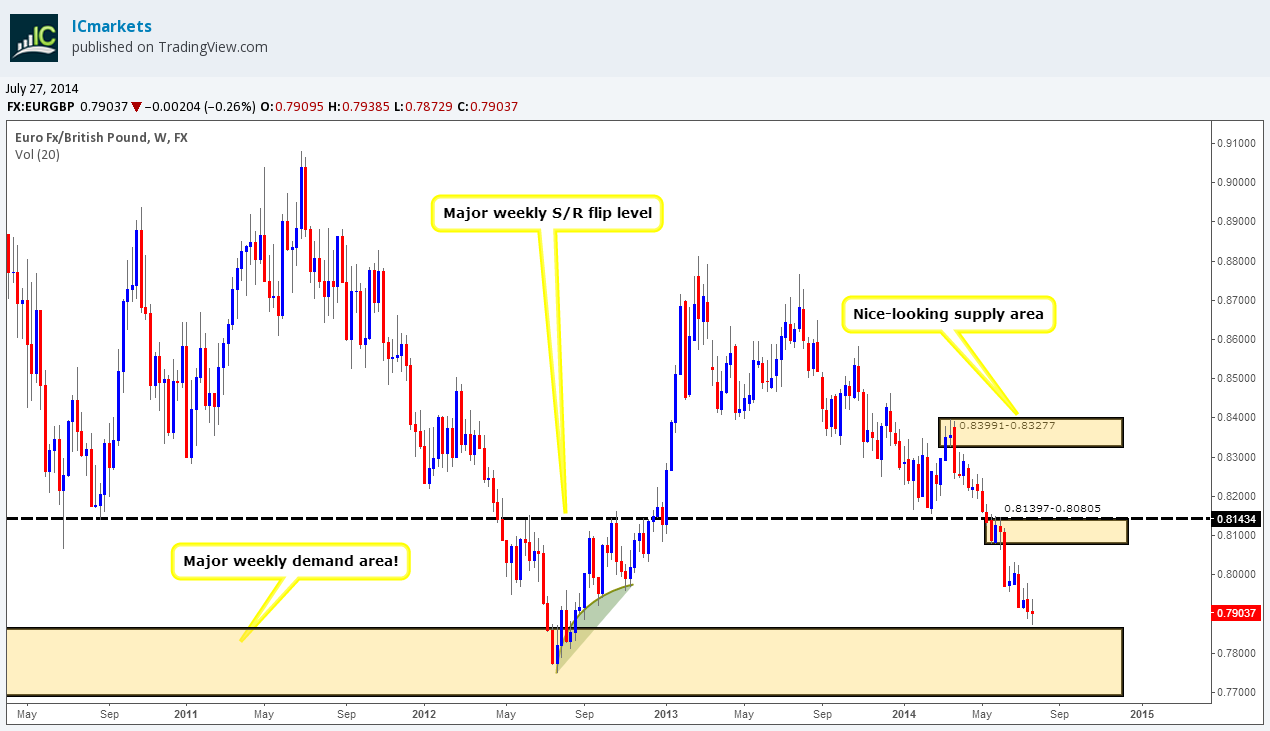
We are literally only a few pips away from hitting weekly demand at 0.79631-0.78623. Last week we saw price form an indecision candle with both buyers and sellers applying equal pressure. As per this timeframe, we still see lower prices deeper into the aforementioned weekly demand area; however the lower timeframes may print a different story.
Daily TF.
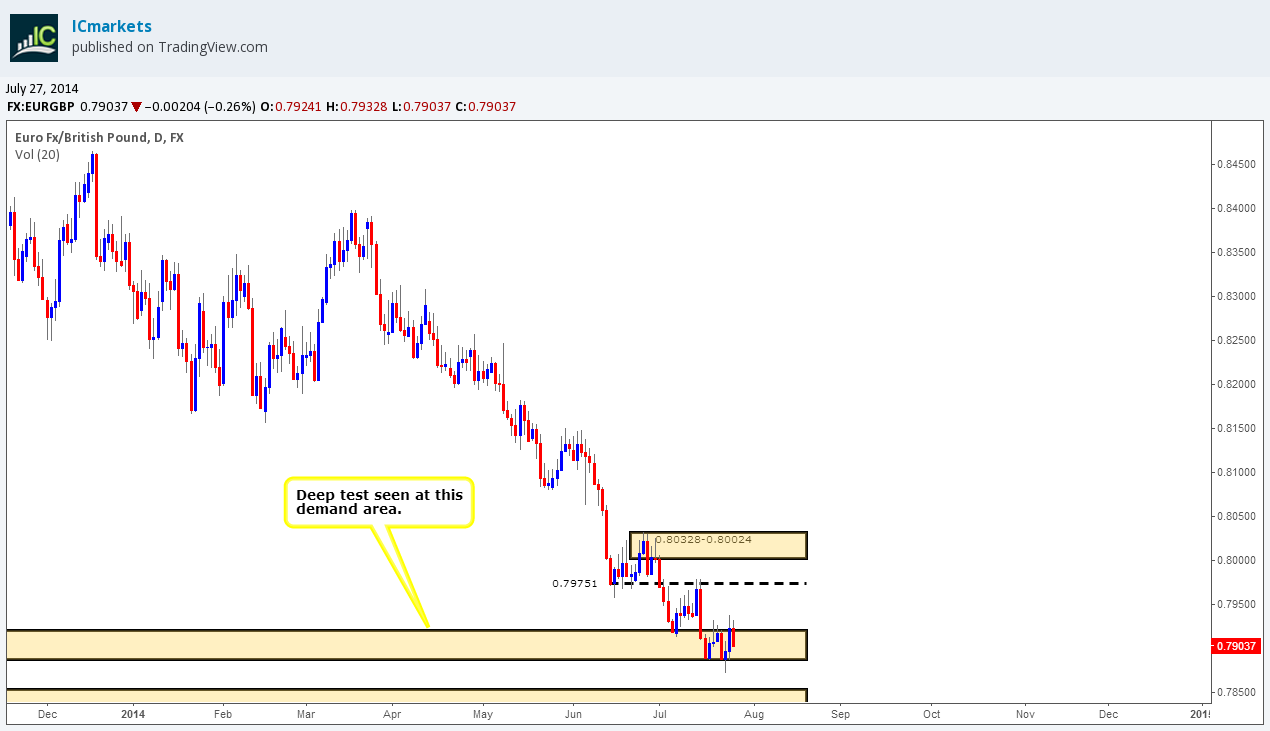
A break south has been seen below daily demand at 0.78862-0.79206, price should be relatively free now to hit the next daily demand area below at 0.78117-0.78533, however, expect the possibility that price may rally to the 0.79751 area before hitting the aforementioned daily demand below. So, with this in mind the market could open up very bullish and fool a lot of traders into thinking a new trend is beginning just above the weekly demand area (see above for the levels), however we know the daily demand area at 0.78862 0.79206 has likely consumed the majority of the buyers, so price can drop south after the prospective rally higher.
4hr TF.
Price did exactly as expected; a push above the 4hr decision-point area at 0.79277-0.79170 to the 4hr S/R flip level directly above at 0.79358 was seen. All those traders with their stops set directly above the aforementioned 4hr decision-point area have now been stopped out only to see price go in the direction they originally planned for.
Theoretically, if our analysis is correct, there is very little stopping price from dropping like a rock this week other than the round number 0.79, a break below this area could possibly seal the deal for price to trade much lower towards the 4hr demand area below at 0.78602-0.78320.
Pending/P.A confirmation orders:
- New pending buy orders (Green line) are seen just above demand (0.78602-0.78320) at 0.78641. The reasoning behind setting a pending buy order here is due to its current location on the higher timeframes. Our 4hr demand area is just above daily demand at 0.78117-0.78533 and also just within the upper area of weekly demand at 0.76931-0.78623.
- No P.A confirmation buy orders (Red line) are seen in the current market environment.
- Pending sell orders (Green line) are seen just below the supply area (0.79795-0.79684) at 0.79651. The reason for a pending sell order being set here, rather than a P.A confirmation sell order was because this area looks very hot for a first-time reaction. Notice how price faked above the S/R flip level at 0.79679 then dropped back down, there is very likely unfilled sell orders still lurking around this area, hence the need for a pending sell order.
- No P.A confirmation sell orders (Red line) are seen in the current market environment.
Quick Recap:
The weekly timeframe shows possible indecision among traders just above the weekly demand area at 0.76931-0.78623, while on the daily timeframe, daily demand at 0.78862-0.79206 has likely been consumed, meaning price is relatively free to hit the next daily demand area below at 0.78117-0.78533. However, we should still expect the possibility of a rally north up to the 0.79751 area before hitting the aforementioned daily demand area. The 4hr timeframe shows the path south is relatively clear, the only possible road bump we can see is the round number 0.79, if we see a close below this, price is very likely going to hit 4hr demand below at 0.78602-0.78320.
- Areas to watch for buy orders: P.O: 0.78641 (SL: 0.78288 TP: Dependent on price approach)P.A.C: No P.A confirmation buy orders are seen in the current market environment.
- Areas to watch for sell orders: P.O: 0.79651 (SL: 0.79828 TP: Dependent on price approach)P.A.C: No P.A confirmation sell orders are seen in the current market environment.
USD/CAD:
Weekly TF.
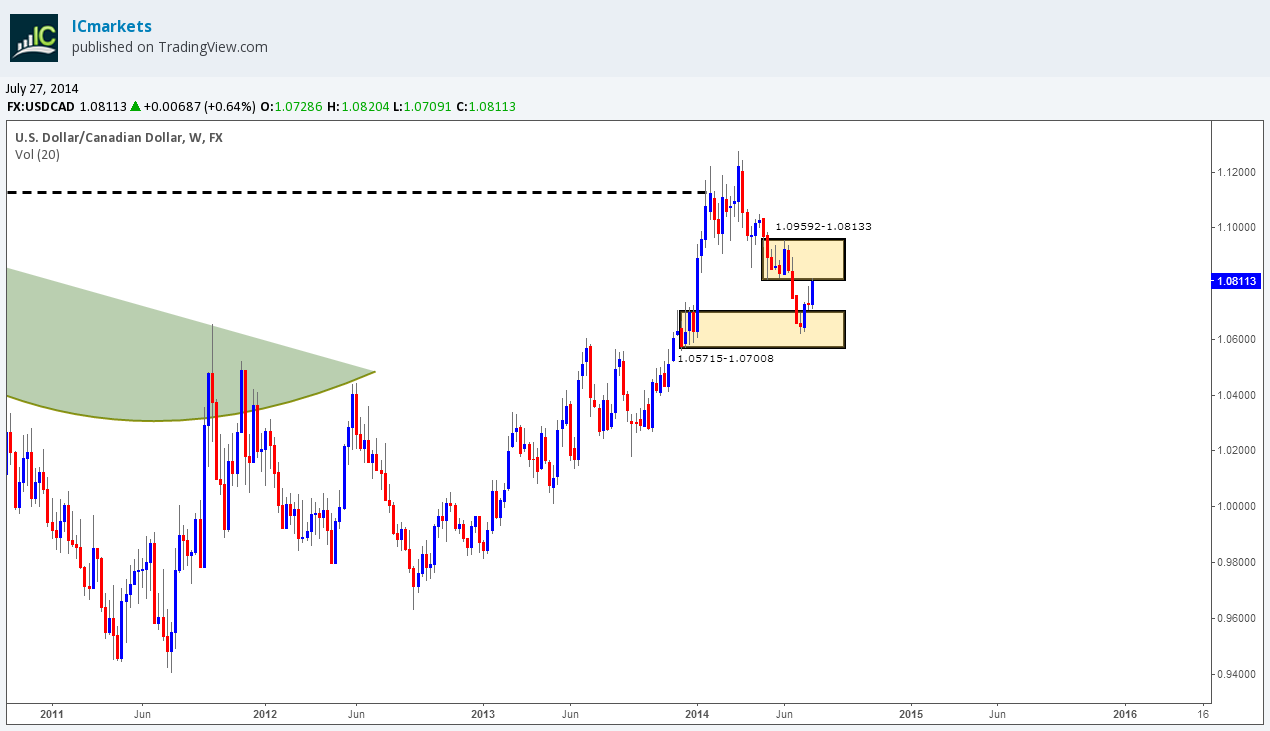
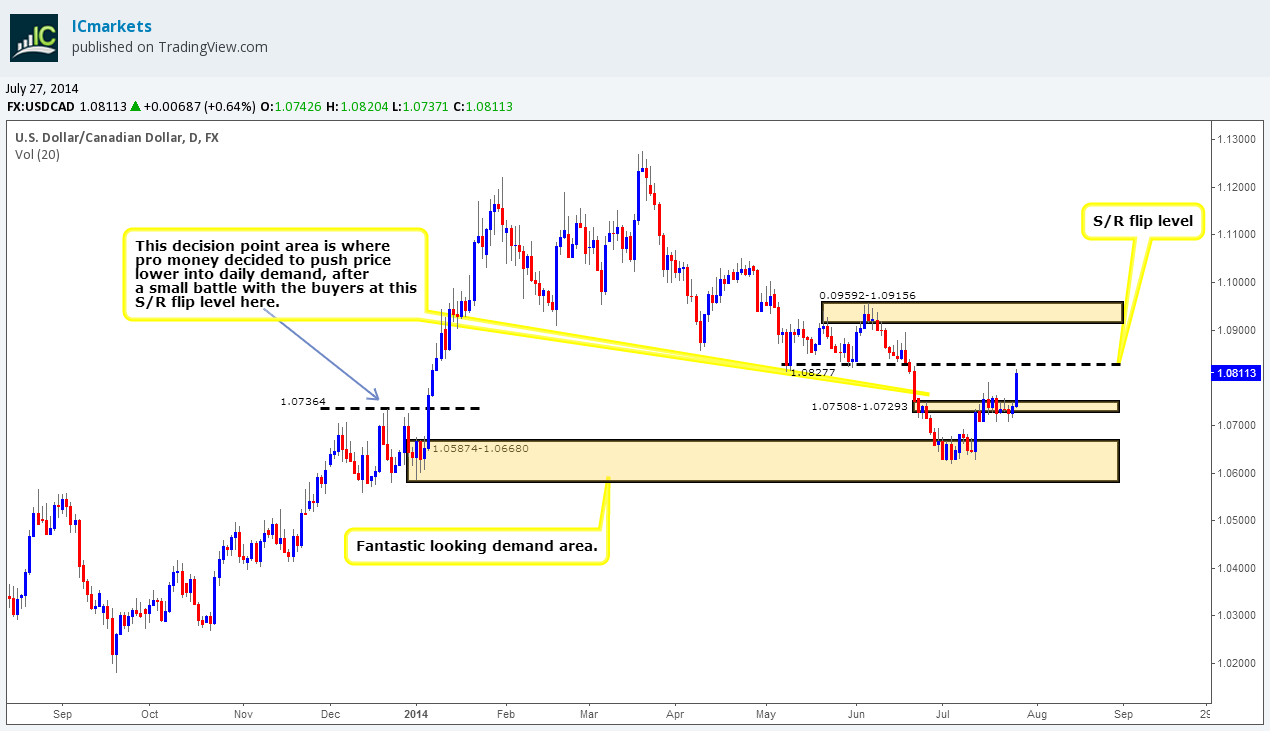
The buyers really worked hard last week, a strong push up to weekly supply at 1.09592-1.08133 was seen. Price still remains capped between the aforementioned weekly supply area and weekly demand below at 1.05715-1.07008. If we see a break of the weekly supply area, things will start to get very interesting as we believe as the profit potential to the upside is huge.
Daily TF.
It has been mentioned quite a few times already that we believe the sellers are consumed around the daily decision-point area at 1.07508-1.07293, Last Friday’s trading sessions confirmed this. Clearly pro money had enough liquidity for this big push up to around the daily S/R flip level at 1.08277, so there was really no need to reverse price back down to daily demand at 1.05874-1.06680. Both the daily and the weekly timeframes are indicating we may see some weakness early this week, so do be prepared for this.
4hr TF.
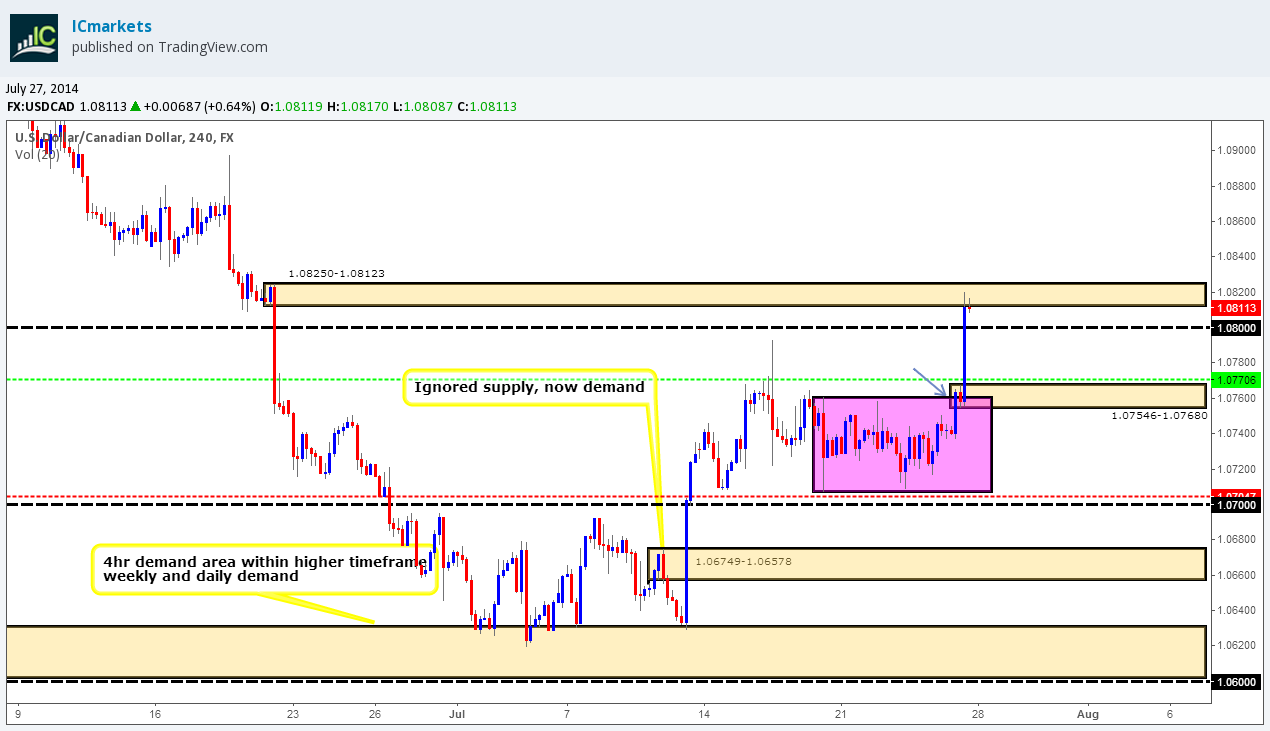
A full-bodied candle closed above where price had been consolidating for most of the week (marked with an arrow), we completely missed the retest opportunity that would have literally turned into instant profit! A small 4hr decision-point area has formed at 1.07546-1.07680, this area remains important as this is the area pro money clearly decided to push prices above the round number 1.08000 into yet another 4hr decision-point area at 1.08250-1.08123.
Now we are sure most are expecting price to retest the round number 1.08000 level very early on sometime this week, and it may do, but we believe doubtful. The higher-timeframes are pointing south, so a retest on the aforementioned round number does not make sense for us. A push down to recently-formed 4hr decision-point area at 1.07546-1.07680 could very well be seen, or if the sellers have the strength down to the round number 1.07000.
Pending/P.A confirmation orders:
- New pending buy orders (Green line) are seen just above the decision-point area (1.07546-1.07680). We have set a pending buy order here as this remains an important area where pro money buyers likely made the decision to break the round number above at 1.08000. We are not expecting a massive reaction here, more a small bounce which we will quickly take advantage of.
- P.A confirmation buy orders (Red line) are seen just above the round number 1.07000 at 1.07047. The reason a P.A confirmation buy order was set here is simply because a pending buy order would be too risky as (on this timeframe) there is no logical area for a stop loss order to be placed.
- No pending sell orders (Green line) are seen in the current market environment.
- P.A confirmation sell orders (Red line) are seen just below the round number 1.08000 at 1.07952 has been cancelled; price blew straight through our entry level.
Quick Recap:
The weekly timeframe shows the buyers have pushed price up to weekly supply at 1.09592-1.08133, while on the daily timeframe, the buyers pushed up to a daily S/R flip level at 1.08277. Buyers and sellers on the 4hr timeframe are currently trapped within two 4hr decision-point areas (1.08250-1.08123….1.07546-1.07680). We favor a decline in value to be seen this week past the round number 1.08000 down to the aforementioned 4hr decision-point area, where we expect to see a bounce at the very least.
- Areas to watch for buy orders: P.O: 1.07706 (SL: 1.07514 TP: Dependent on price approach)P.A.C: 1.07047 (SL: Dependent on price action after the level has been confirmed TP: Dependent on approaching price action after the level has been confirmed).
- Areas to watch for sell orders: P.O: No pending sell orders seen within the current market environment. P.A.C: No P.A confirmation sell orders seen within the current market environment.
USD/CHF:
Weekly TF.
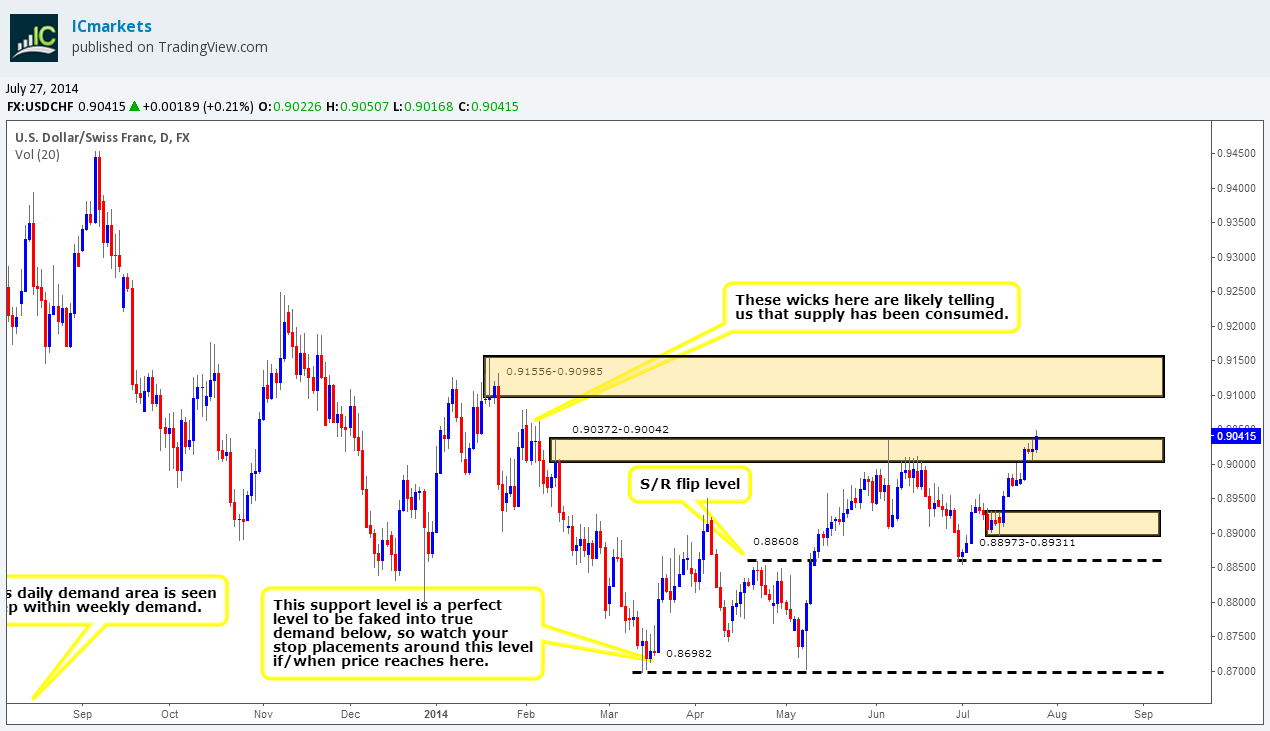
The buyers pushed price quite hard last week, and broke the mundane range that has formed above weekly demand at 0.85664-0.88124. If the buying pressure continues this week, we will very likely see price hit an important weekly decision-point level at 0.90927.

Daily TF.
A break above a daily supply area has been seen at 0.90372-0.90042, this is where things get interesting. It is very likely that the sellers are now consumed around the aforementioned daily supply area, thus clearing the path up to around the next daily supply area at 0.91556-0.90985. There is very little to left that we can see that will cause a problem to price if the buyers wanted to push it up that far. Notice the wicks seen in between these two areas? These wicks indicate likely supply consumption which makes the possibility of higher prices even stronger.
But, if pro money does not have the required liquidity, in this case sell orders to buy into, they will have to reverse price. We can see two obvious areas where they may reverse price to, a small daily demand area at 0.89973-0.89311 and the daily S/R flip level at 0.88608 below, it will be very interesting to see how price action unfolds this week.
4hr TF.
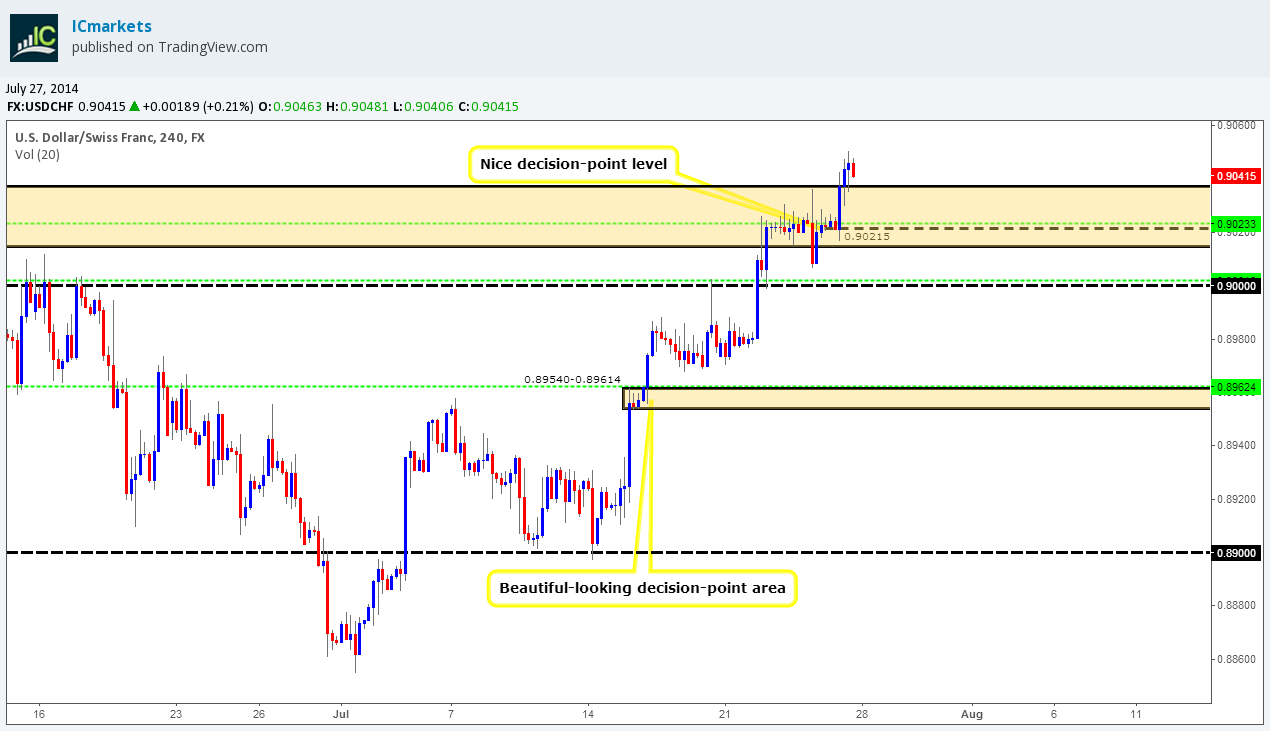
It was mentioned in Friday’s analysis that the wicks seen within the 4hr supply area at 0.90372-0.90148 likely consumed the sellers enough for this area to see a break north, which did happen. However, we also believed price would reverse back down to the round number 0.9, this clearly did not happen.
A break above the aforementioned 4hr supply area has likely opened up the possibility to much higher prices. Take a look to the left of the chart above this 4hr supply area. We can see lots of wicks indicating supply has been consumed right up to a 4hr S/R flip level at 0.90891, essentially all this does is confirm our daily analysis with a more magnified view. A rally straight up to this S/R flip level is unlikely, instead a reversal may be seen down to the 4hr decision-point level at 0.90215, or if the sellers have the strength, a further push south may be seen towards the round number 0.9 before the higher prices are seen.
Pending/P.A confirmation orders:
- Pending buy orders (Green line) are seen just above the round number 0.90000 at 0.90018. We would not normally set a pending buy order around a round number level such as this; however the first retest seen of this level gives us confidence to place an order such as this.
- Pending buy orders (Green line) are seen just above the decision-point level (0.89540-0.89614) at 0.89624. A pending buy order was placed here because this area remains an important decision-point area where the buyers ‘decided’ to trade above multiple highs to the left.
- New pending buy orders (Green line) are seen just above the decision-point level (0.90215) at 0.90233. The reasoning behind placing a pending buy order here is simply because this is the area on the 4hr timeframe where pro money buyers likely made the decision to break above the 4hr supply area at 0.90372-0.90148, hence the possibility there may still be unfilled buy orders lurking around this level.
- No P.A confirmation buy orders (Red line) are seen in the current market environment.
- No pending sell orders (Green line) are seen in the current market environment.
- No P.A confirmation sell orders (Red line) are seen in the current market environment.
Quick Recap:
The weekly shows the buyers have pushed price higher nearly touching a small decision-point level at 0.90927, while on the daily timeframe, a break above daily supply at 0.90372-0.90042 has been seen, a rally up to the next oncoming daily supply area at 0.91556-0.90985 will likely be seen soon, however we must be prepared for a bearish retracement beforehand down to around daily demand at 0.88973-0.89311 at the very least. A break above 4hr supply at 0.90372-0.90148 has been seen on the 4hr timeframe, we can likely expect a rally up to at least the 4hr S/R flip level at 0.90891 soon, however, we must be prepared for a reversal south beforehand down to at least the 4hr decision-point level at 0.90215, which is where we have a pending buy order set just above at 0.90233.
- Areas to watch for buy orders: P.O: 0.89624 (SL: 0.89523 TP: Dependent on price approach) 0.90018 (SL: 0.89928 TP: Dependent on price approach) 0.90233 (SL: 0.90117 TP: Dependent on price approach). P.A.C: No P.A confirmation buy orders seen in the current market environment.
- Areas to watch for sell orders: P.O: No pending sell orders seen in the current market environment. P.A.C No P.A confirmation sell orders seen in the current market environment.
XAU/USD (GOLD)
Weekly TF.
Selling pressure has begun to weaken out of weekly supply at 1391.97-1328.04 with two tails being seen indicating buying interest. Price is currently capped between the aforementioned weekly supply area and a nice-looking weekly decision-point level below at 1244.08.
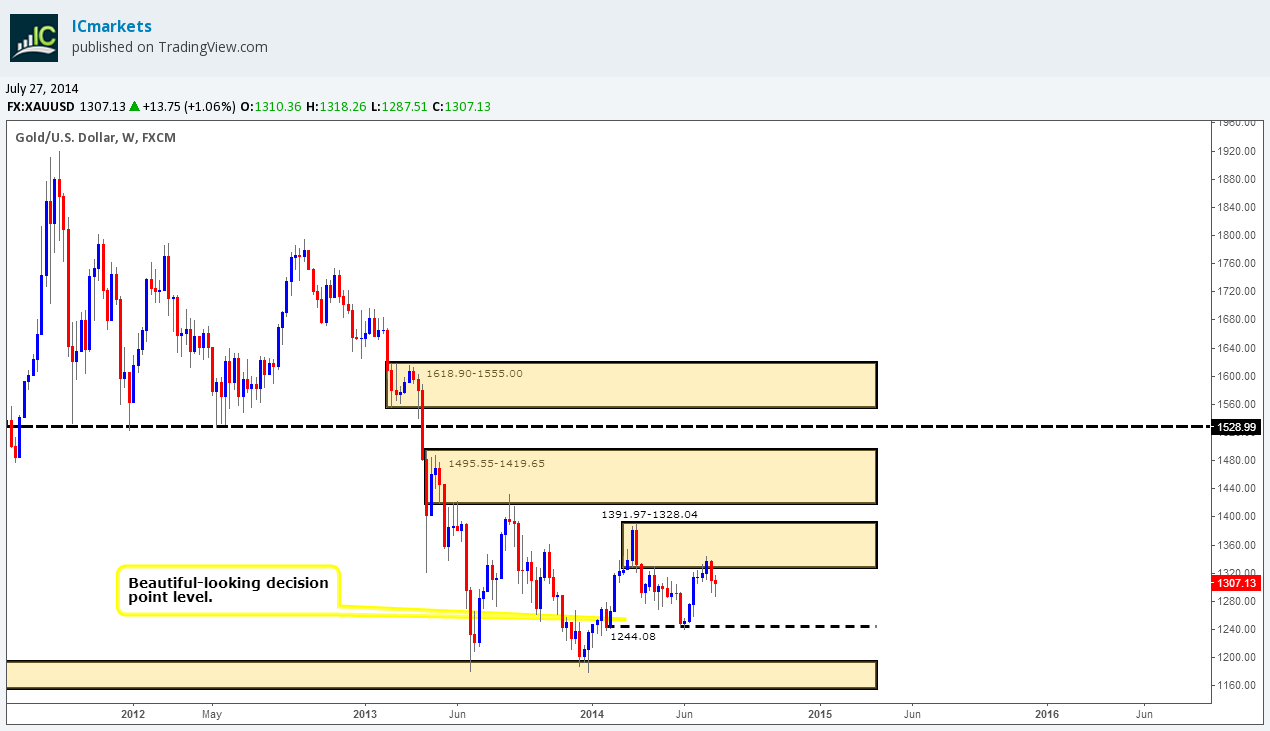
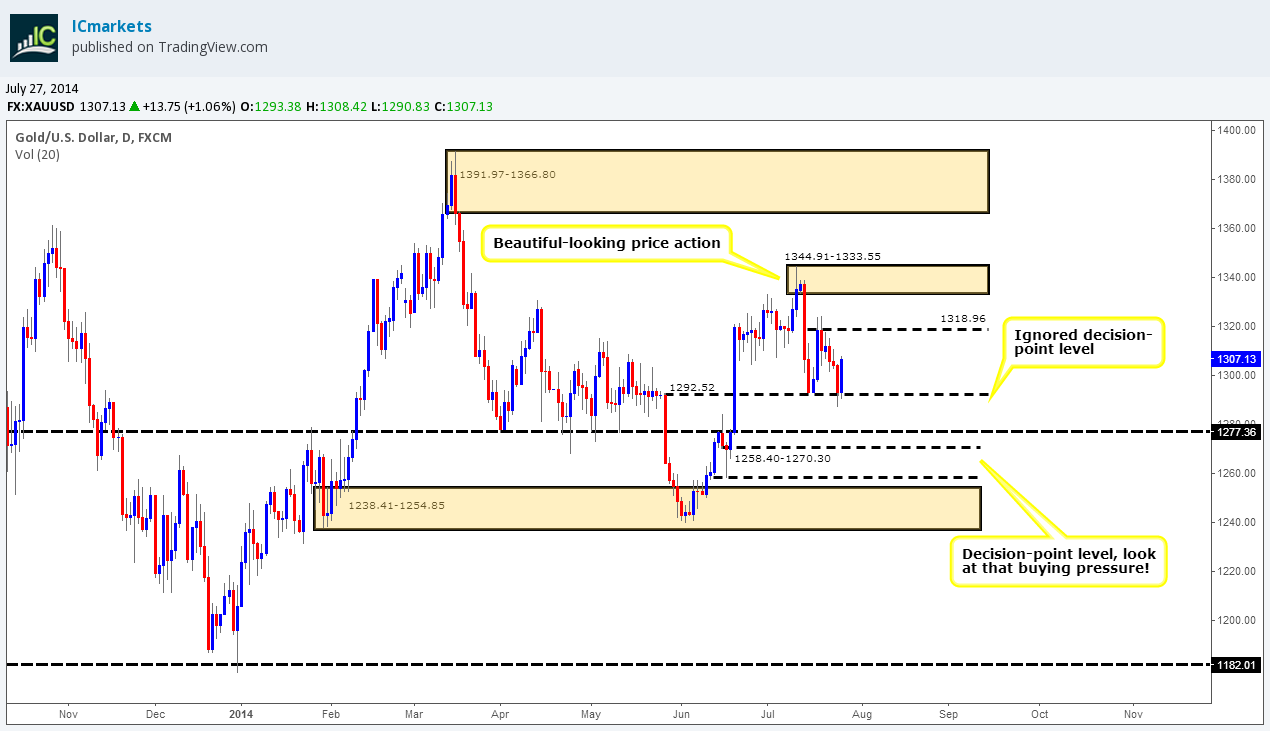
Daily TF.
The ignored decision-point level at 1292.52 has provided the buyers a beautiful place to rocket prices north. The next area of trouble seen for the buyers is around a daily decision-point level at 1318.96, any traders who are currently long definitely want to pay attention once we reach this level.
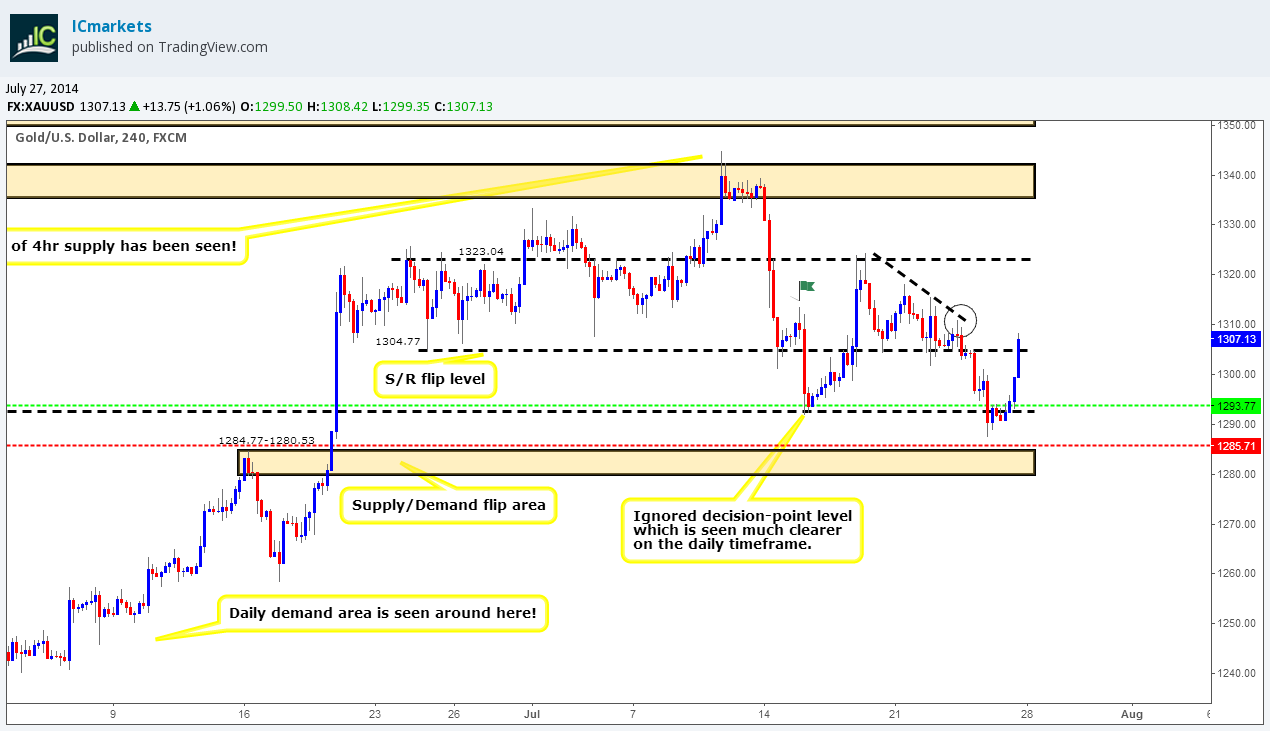
4hr TF.
The ignored decision-point level at 1292.52 (seen clearer on the daily timeframe) has proved to be a level worth watching. Price slammed hard into this level, no doubt stopping out lots of traders attempting to go long with their stops to close, and also trapping countless breakout traders in the process.
Price closed above the 4hr S/R flip level at 1304.77 late last Friday, if we see a break above the high marked with a circle at 1311.07, then there is very little stopping price from hitting the 4hr R/S flip level above at 1323.04. Our reasoning behind thinking this is because of price action to the left. The small trendline is not there to depict a trend as such, it is more to show how pro money likely consumed the sellers as price was declining, thus very likely clearing the path north for the buyers in the future.
Pending/P.A confirmation orders:
- The pending buy order (Green line) set just above the ignored decision-point level at 1292.52 at 1293.77 is now active. Our first take-profit level was hit late Friday at 1304.77, so do keep an eye out for our second and final take-profit level set at 1323.04.
- P.A confirmation buy orders (Red line) are seen just above the S/D flip area (1284.77-1280.53) at 1285.71. We have set a P.A confirmation buy order here simply because we could not find a logical area for the stop-loss order, so to avoid any deep spikes; we have decided to wait for confirmation.
- No pending sell orders (Green line) are seen in the current market environment.
- No P.A confirmation sell orders (Red line) are seen in the current market environment.
Quick Recap:
The weekly timeframe shows selling weakness out of weekly supply at 1391.97-1328.04, while on the daily timeframe, the ignored decision-point level at 1292.52 has proved a good level to watch as the buyers pushed off from here quite aggressively. Our pending buy order set just above the aforementioned decision-point level at 1293.77 on the 4hr timeframe has been successful, our first take-profit level was hit at 1304.77, our second and final take-profit level is set above at 1323.04, we are confident price will reach here if we see a break above the high (circled) at 1311.07.
- Areas to watch for buy orders: P.O: 1293.77 (Active) (SL: 1286.75 TP: [1] 1304.77 [2] 1323.04).P.A.C: 1285.71 (SL: Dependent on price action after the level has been confirmed TP: Dependent on approaching price action after the level has been confirmed).
- Areas to watch for sell orders: P.O: No pending sell orders seen in the current market environment. P.A.C: No P.A confirmation sell orders seen in the current market environment.


