Previous Story
Monday 28th September: Weekly technical outlook and review
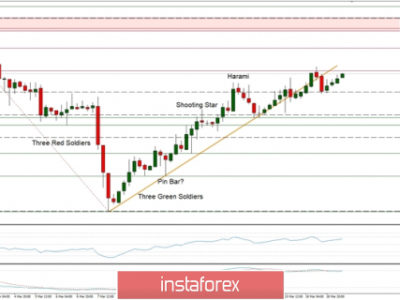
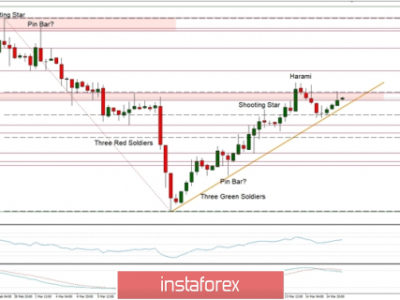
A note on lower timeframe confirming price action…
Waiting for lower timeframe confirmation is our main tool to confirm strength within higher timeframe zones, and has really been the key to our trading success. It takes a little time to understand the subtle nuances, however, as each trade is never the same, but once you master the rhythm so to speak, you will be saved from countless unnecessary losing trades. The following is a list of what we look for:
- A break/retest of supply or demand dependent on which way you’re trading.
- A trendline break/retest.
- Buying/selling tails – essentially we look for a cluster of very obvious spikes off of lower timeframe support and resistance levels within the higher timeframe zone.
- Candlestick patterns. We tend to only stick with pin bars and engulfing bars as these have proven to be the most effective.
EUR/USD:
Weekly view: Overall, It was quite a disappointing week for the EUR. The pair lost a little over 100 pips into the close 1.1191 with price reaching lows of 1.1105. Quite frankly, however, this recent decline in value means very little to us, since for four weeks now the market has been and continues to range around the underside of supply at 1.1532-1.1278.
Should price break above this area this week, the next limit to keep an eye on can be seen at 1.1745 – an ignored Quasimodo level. Conversely, a continuation move lower could possibly see prices drive deeper into the weekly range down to as far demand drawn from 1.0519-1.0798.
Weekly levels to watch this week fall in at: 1.1532-1.1278/1.1745.
Daily view: From this angle it’s clear to see that the 1.1122 support line is holding the EUR higher for now. It did so going into Wednesday’s session, as well as Fridays which printed a nice-looking buying tail as a result. Should weekly sellers muster enough strength from supply this week, we could see this support consumed and price attack demand just below it at 1.1015-1.1076. Not only is this demand barrier fresh, but, as you can see, it also converges beautifully with an ascending trendline taken from the low 1.0319. On the flip side, supply at 1.1329-1.1269 held well during Thursday’s trade, so this also could be an area to keep a tab on this week.
Daily levels to watch this week fall in at: 1.1122/ 1.1015-1.1076/ 1.1329-1.1269.
4hr view: As can be seen from the 4hr chart, there was unfortunately no retest of 1.1200 before price hit the 1.1150 mark on Friday, which is something our team were keen on trading (http://blog.icmarkets.com/friday-september-25th-daily-technical-outlook-and-review/). Instead, the EUR continued lower, surpassing 1.1150 and connecting with demand at 1.1105-1.1131, before rallying for the remainder of the day and wrapping the week up just below 1.1200.
Going forward, this pair opened relatively calmly this morning at 1.1182, gapping only nine pips lower than Friday’s close. With regards to today’s upcoming sessions, price has the potential to either sell-off from beneath 1.1200 back down to 1.1150/ 1.1105-1.1131, or could just as well break above this number and head in the direction of 1.1250/1.1257.
The reason we believe either of the above could be seen simply comes from looking at the daily action loitering mid-range between support at 1.1122 and supply at 1.1329-1.1269 (see above/chart) at present. In addition to this, notice that both the 4hr zones 1.1250 and 1.1105-1.1131 also coincide nicely with the above said daily areas, so do have these noted down for potential trades early on this week.
Levels to watch/live orders:
- Buys: Watch for offers at 1.1200 to be consumed and then look to enter on any retest seen at this number (confirmation required).
- Sells: 1.1200 [Tentative- confirmation required] (Stop loss: dependent on where one confirms this level).
GBP/USD:
Weekly view: Pound Sterling suffered a rather nasty drop last week losing around 350 pips at the close (1.5172), which ended with price piercing demand coming in at 1.5169-1.5260. As can be seen, just beneath this area sits a channel support line (1.4564), followed closely by demand taken from 1.4855-1.5052. Given the fact that the current demand is likely weak now (see above in bold), we believe Cable will drill a little lower to either of the above said areas before any noteworthy correction takes place. It will be interesting to see what the lower timeframes have to offer…
Weekly levels to watch this week fall in at: 1.5169-1.5260/channel support (1.4564)/ 1.4855-1.5052.
Daily view: Following the indecision candle printed during Thursday’s trade off the back of a descending channel support (1.5329), price continued to drive lower into Friday’s session, pushing this market into the jaws of demand at 1.5088-1.5173. Even though this area appears firm, there’s a strong possibility that this zone will be tested further this week since the aforementioned weekly channel support converges with the lower limits of this area (see above). Therefore, a reaction is highly likely from this zone, only a little deeper than the previous two touches seen at 1.5178/1.5162 back in June and early September.
Daily levels to watch this week fall in at: 1.5088-1.5173.
4hr view: As is evident from the chart, our pending buy order taken at 1.5188 was stopped on a fakeout below demand at 1.5162-1.5187 mid-way through London trade. Following this fake lower, little development was seen from here as near-term psychological resistance 1.5200 held strong going into the close.
This morning’s open 1.5179, however, has so far seen a relatively steady flow of bids hit the line, pushing this pair back up to the jaws of 1.5200. Given this – coupled with our analysis above, where do we see this market heading to today and possibly into the week? Well, of course, there is a chance the buyers could continue to push this market higher today and reach 1.5250, or even possibly 1.5300 given enough time. This could be something to keep an eye on today as there may be a chance to play for an intraday retest of 1.5200 up to the above said numbers.
Be that as it may, taking into account the higher timeframe structure (see above), we still favor lower prices before this pair sees any noticeable advance north. With that being said, the 4hr swap (support) level seen just below at 1.5114 is a barrier we believe to be a perfect buy zone to have on one’s radar for (confirmed) buying opportunities today/this week. The reason being is that It merges not only with the lower limits of daily demand mentioned above at 1.5088-1.5173, but also with the aforementioned weekly channel support, making it a very high-probability turning point in this market.
Levels to watch/ live orders:
- Buys: Watch for offers at 1.5200 to be consumed and then look to enter on any retest seen at this number (confirmation required) 1.5114 [Tentative – confirmation required] (Stop loss: dependent on where one confirms this level).
- Sells: Flat (Stop loss: N/A).
AUD/USD:
Weekly view: After a two-week rally from demand at 0.6768-0.6942, the Aussie slid south last week, losing around 160 pips and erasing most of the recent gains by the weeks end. As you can see, this move brought price back down into the arms of the above said demand area, which saw a slight reaction going into the close 0.7020. Whether this area will hold or not is very, very difficult to judge seeing as the Aussie pair still remains in a humongous downtrend at present. Should this zone give way, however, the next area we have in our sights is demand coming in at 0.6284-0.6525.
Weekly levels to watch this week fall in at: 0.6768-0.6942/0.6284-0.6525.
Daily view: Turning our attention to the daily timeframe, we can see that the first three days of last week’s trade was quite depressing. It was only once price entered into Thursday’s session did things begin turning around. Notice on this scale, price just missed connecting with demand at 0.6768-0.6923. This is because this zone is lodged a little deeper within the weekly demand area mentioned above at 0.6768-0.6942.
With the remainder of the week spent hugging the underside of a major swap resistance level at 0.7035, looking to buy from the current weekly demand zone we discussed above may not be the best path to take until offers are cleared from here. In the event that a sustained move is indeed seen above 0.7035 this week, the next objective to reach comes in at 0.7204-0.7119 – a potentially weak supply area.
Daily levels to watch this week fall in at: 0.6768-0.6923/0.7035/0.7204-0.7119.
4hr view: During the course of Friday’s sessions, this market centralized itself between supply at 0.7064-0.7039 and psychological support at 0.7000. As we explained in Friday’s report (http://blog.icmarkets.com/friday-september-25th-daily-technical-outlook-and-review/), considering that the weekly demand at 0.6768-0.6942 was tagged into the action last week, and the daily swap (resistance) level at 0.7035 appears to be holding firm, there is somewhat of a tug-of-war taking place on this pair at the moment.
Therefore, as the aforementioned 4hr supply appears to be supported by the major daily swap (resistance) level at 0.7035, and the 4hr demand at 0.6945-0.6962 backed by weekly demand at 0.6768-0.6942, it is difficult to judge direction until either one of the above breaks.
With this in mind, the most conservative path still to take, in our opinion, is to watch both of the aforementioned 4hr areas for potential fade opportunities today/this week. Should either produce lower timeframe price action to trade, we believe it’s likely worth at least a scalp to 0.7000.
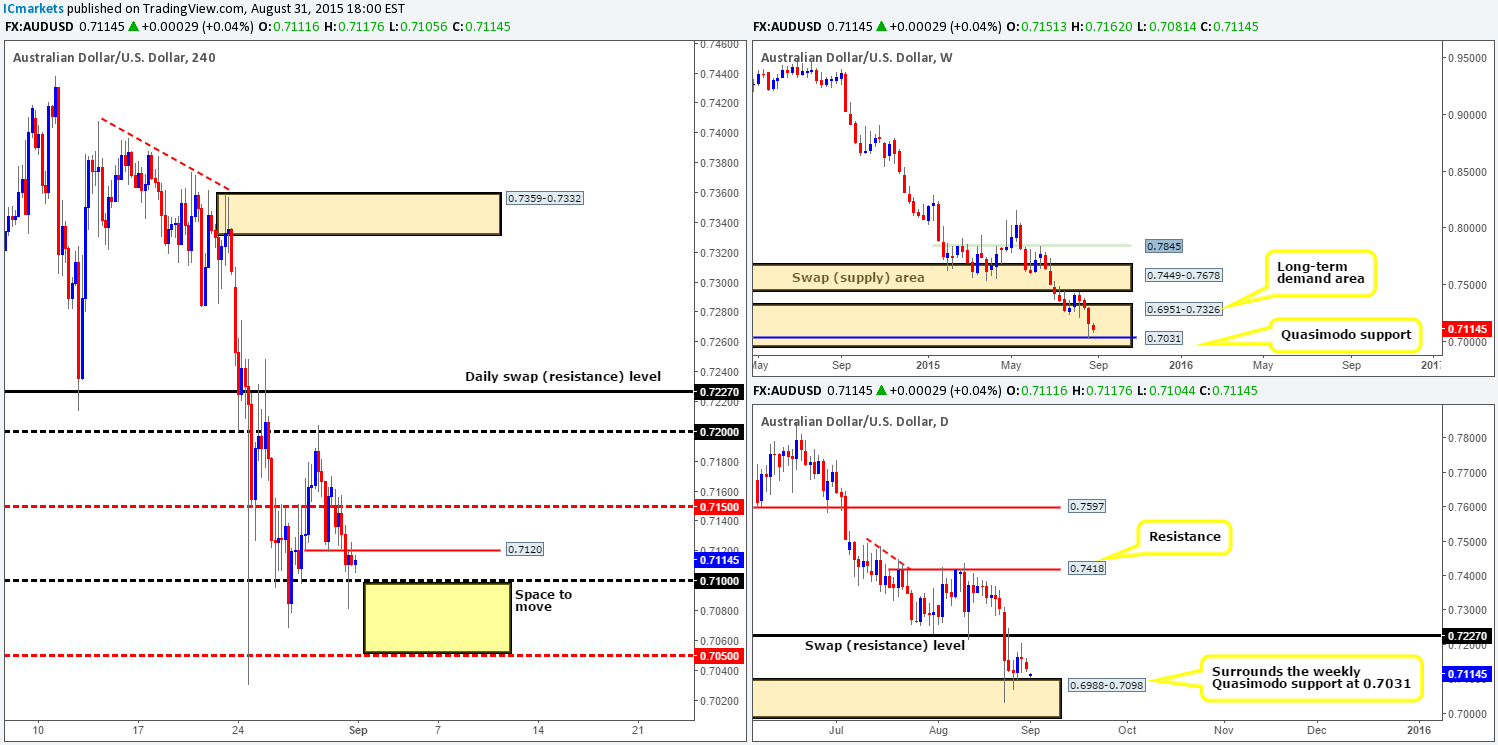
- Buys: 0.6945-0.6962 [Tentative – confirmation required] (Stop loss: dependent on where one confirms this area).
- Sells: 0.7064-0.7039 [Tentative – confirmation required] (Stop loss: dependent on where one confirms this area).
USD/JPY:
Weekly view: Similar to the week prior, there is really very little to report on last week’s action on this timeframe. Price continued to trade in between a swap resistance zone at 122.01-121.40 and a support area drawn from 118.22-119.25, with the market gaining a little over sixty pips into the close 120.54.
Weekly levels to watch this week fall in at: 122.01-121.40/118.22-119.25.
Daily view: With little change being seen on the weekly timeframe last week, we can see that price also remained confined on this timeframe between demand at 118.60-119.26 and a swap resistance level at 120.59. A breakout above here this week would likely see this market head towards at least swing resistance at 121.72, followed closely by a swap supply zone at 122.15-122.86. On the other hand, a push lower would immediately see price shake hands with support coming in at 118.38. At the time of writing, price is hugging the upper limit of this range, so any long trades planned in the market should be taken with caution!
Daily levels to watch this week fall in at: 118.60-119.26/118.38/120.59/121.72/ 122.15-122.86.
4hr view: For those who read Friday’s report (http://blog.icmarkets.com/friday-september-25th-daily-technical-outlook-and-review/), we mentioned to watch for potential sells around the 120.77 region. Clearly it was not to be! Price smashed through this level (producing little to no lower timeframe selling price action), and collided with 4hr supply at 121.40-121.07 mid-way through London trade. It was from this point that active sellers were seen entering the market. 120.77 did initially hold as support, but very soon after gave way, sending price tumbling back into the descending channel resistance area (121.31/119.65) towards mid-level support at 120.50.
Breaking into a new week, this pair, as you can see, opened at 120.50, and has so far held steady at this support line. We think it’s fair to say that this market, unless an explosive move is seen that is, will be relatively difficult to find any medium-term setups this week. Reason being is that right now we have weekly action trading mid-range within a tight consolidation, and price on the daily timeframe, although ranging as well, is kissing the underside of a swap resistance level (see above). Therefore, until the weekly/daily show somewhat clearer direction between the two, here are our pre-determined 4hr levels we have noted down for potential intraday bounce trades this week:
- Buys: 120.50/119.77/119.50/119.00.
- Sells: Underside of channel resistance/120.77/121.40-121.07.

Levels to watch/ live orders:
- Buys: 120.50/119.77/119.50/119.00 (confirmation at these levels is required).
- Sells: Underside of channel resistance/120.77/121.40-121.07 (confirmation at these levels is required).
USD/CAD:
Weekly view: Following the buying tail off the back of an ignored Quasimodo level at 1.3014, an advance higher was seen gaining a little over 100 pips on the week and concluding trade at 1.3324. Something we have to bear in mind here is that although a push higher was seen which forced price to close above recent weekly highs, it also drove this market into a swap resistance level at 1.3381. This, in itself, could potentially halt any further buying this week. Let’s see what we can find on the lower timeframes.
Weekly levels to watch this week fall in at: 1.3381/1.3128.
Daily view: Rolling a page lower to the daily timeframe shows that Thursday’s action beautifully pinned through supply at 1.3352-1.3284 into another supply coming in just above it at 1.3530-1.3405. However, Friday’s response to this pin was not exactly what we’d call enthusiastic! Should a later sell-off still be seen from here this week, nonetheless, we’ll be watching the ascending trendline taken from 1.2562 for a rebound, followed closely by demand seen at 1.3530-1.3405.
Daily levels to watch this week fall in at: 1.3352-1.3284/1.3530-1.3405/ascending trendline (1.2562)/ 1.3530-1.3405.
4hr view: Looking at Friday’s 4hr action is enough to make one’s eyes cross! The mish-mash of wicks/tails seen between psychological support 1.3300 and mid-level resistance 1.3350 made trading this pair on Friday almost impossible for us.
With little change seen to the overall structure of the 4hr timeframe at this morning’s open1.3334, and due to Friday’s somewhat lackluster performance, much of the following analysis will be similar to the previous.
Given the position of this market on the higher timeframes (see above in bold) at present, we believe a possible break below 1.3300 is on the cards today. Should this play out, traders may get the chance to sell the retest of this number down to 1.3200. Why 1.3200? The reason being is simply because we see very little active demand left in between this area. Check out the very obvious demand consumption tails seen marked with black arrows at: 1.3249/1.3233/1.3217. These tails, in our opinion, have already cleared the path south for further selling! Despite this, the mid-level barrier could potentially be troublesome to a short from 1.3300, so do keep a close eye on how the lower timeframe price action responds here. If bullish strength is seen, we would certainly advise liquidating at least 60% of your position and moving the stop to breakeven.

Levels to watch/ live orders:
- Buys: Flat (Stop loss: N/A).
- Sells: Watch for bids at 1.3300 to be consumed and then look to enter on any retest seen at this number (confirmation required).
USD/CHF:
Weekly view: Last week’s action saw the USD/CHF rally back up to the underside of a swap resistance level at 0.9796, which, as you can see, converges nicely with a trendline from the high 1.0239. This advance posted gains of over 100 pips at the close 0.9783.
With the rebound from this swap level seen three weeks ago only reaching lows of 0.9526, the validity of this hurdle is now in question. With that said, a close above this barrier could open the trapdoor for prices to eventually challenge supply given at 1.0239-1.0131.
Weekly levels to watch this week fall in at: 0.9796/1.0239-1.0131.
Daily view: Branching one lower to the daily timeframe, it’s clear to see that there is a swap support level lurking at just below the aforementioned weekly swap (resistance) area at 0.9689. This daily level managed to hold this market higher on Thursday as the sellers attempted to push this pair lower from the weekly barrier. In the event that bids remain strong at this level going into this week, it could mean higher prices for this pair.
A break above the weekly level on the daily scale may suggest further upside towards 0.9893 – a clean resistance which proved itself beautifully back in mid-August at 0.9888.
Daily levels to watch this week fall in at: 0.9689/0.9796/0.9893.
4hr view: Following on from Friday’s report (http://blog.icmarkets.com/friday-september-25th-daily-technical-outlook-and-review/), price did in fact fake above 0.9800 and, as can be seen from the chart, just missed connecting with the small 4hr supply zone seen at 0.9859-0.9848 before selling off. This saw price collide with mid-level support at 0.9750 and bounce back up to just below 0.9800 by the weeks end.
Today’s open 0.9778, nonetheless, has seen a conservative influx of bids come into this market, reaching highs of 0.9797 so far. By and large, 0.9800 is still considered by us to be a significant resistance level in this market as it merges so beautifully with the aforementioned weekly swap resistance. Therefore, even though we believe this weekly level to be possibly weak now (see above), we cannot completely dismiss the idea of shorting from 0.9800 today, and also the aforementioned 4hr supply area just above it. These two base areas will only become invalid, in our book, once/if a daily close is seen above the current weekly resistance.

Levels to watch/ live orders:
- Buys: Flat (Stop loss: N/A).
- Sells: 0.9800 [Tentative – confirmation required] (Stop loss: dependent on where one confirms this level) 0.9859-0.9848 [Tentative – confirmation required] (Stop loss: dependent on where one confirms this area).
DOW 30:
Weekly view: Although the DOW finished lower on the week by around 120 points at the close (16300), we see this as a positive week all in all. The reason for why is because of how price responded when it connected with support at 15978. There is clear buying interest here and since only pro money can produce buying tails of this magnitude, we consider this to be a strong support. Should this market remain well-bid this week, there’s room, as far as we see, for price to appreciate up to at least the weekly swing high 16935, followed closely by the swap resistance level drawn from 17135.
Weekly levels to watch this week fall in at: 15978/17135.
Daily view: Daily action on the other hand shows buying pressure came into this market from a clear line of support at the 16083 region on Thursday, painting a nice-looking buying tail as a result. In addition, this move also forced price to touch gloves with a swap supply area at 16306-16436 during Friday’s session, which saw the DOW sell-off, and end the week printing an opposing selling wick. Therefore, until the offers at the aforementioned swap supply area are taken out, weekly buyers from 15978 will struggle to move this market higher. Once/if this barrier is consumed, however, this timeframe shows potential up to the swap supply area coming in at 16895-17005.
Daily levels to watch this week fall in at: 16083/ 16306-16436/ 16895-17005.
4hr view: (Update: Closed out our full long position for around a 2.5 risk/reward win)
From this angle, it is clear to see that the DOW began reversing going into the London session on Friday, which pulled price down to lows of 16277 on the day.
This morning’s open 16300 has so far seen the DOW continue to sell-off. As such, there are two areas we currently have noted down for possible (confirmed) buy trades today/during the week. The first falls in at a swap support level drawn from 16184, followed closely by the recently respected demand zone at 15977-16083. This demand, as can be seen from the daily timeframe, converges with support coming in at 16083, so do keep a close tab on this zone!
As for shorting this market, we have to be honest we are a little more hesitant due to price trading from weekly support at 15978. Waiting for lower timeframe confirmation at the following areas is paramount in our book to short this market. The areas we have jotted down so far are two very closely-knit supply areas; one could almost call them stacked! The lower zone comes in at 16474-16416, and the one above at 16586-16517. In addition, there is an interesting level just above here at 16664. This is essentially a Quasimodo resistance line. What we really like about this level, however, is the rally base drop (16611-16703) that lines up with the left shoulder of this pattern. It’s fresh and thus will likely see a bounce when hit.

Levels to watch/ live orders:
- Buys: 16184/15977-16083 (Lower timeframe confirmation required at both areas).
- Sells: 16474-16416/ 16586-16517/ 16664 (Lower timeframe confirmation required at both areas)
XAU/USD: (Gold)
Weekly view: Follow-through buying was seen on Gold last week, pushing price up to the underside of a swap resistance level seen at 1157.4. As shown on the chart, the market did respond to this level but in all honesty we expected a more defined sell-off, as price was still able to close higher on the week at 1145.5. Should this level give way this week, it’s likely this market will head in the direction of supply taken from 1205.6-1181.2. This area, in our opinion, is a perfect zone to look for shorts. It not only converges with a bearish Harmonic AB=CD pattern (1199.4), but also with the underside of a long-term trendline extended from the high 1488.0.
Weekly levels to watch this week fall in at: 1157.4/ 1205.6-1181.2.
Daily view: From the daily scale, however, we witnessed price aggressively break above supply seen at 1147.8-1134.2 on Thursday, which should theoretically act as demand now. There was a little reaction seen from here on Friday, but nothing to write home about! In the event that barrier provides this market a platform in which to advance higher from this week, we see price likely rallying to connect with the swap resistance level at 1167.2.
Supposing bids are weak at current prices, nonetheless, its possible Gold could decline all the way back down to origin – a swap demand seen at 1126.7-1118.9.
Daily levels to watch this week fall in at: 1147.8-1134.2/1167.2/ 1126.7-1118.9.
4hr view: Amid Friday’s trade, we saw Gold continue to depreciate in value following Thursday’s rebound from 1156.5. This dragged price down into the jaws of a swap demand area seen at 1141.6-1138.6, which, as you can see, held firm and saw a small rally into the weeks end. This was an area highlighted to watch for potential confirmed buys on Friday – well done to any of our readers who managed to lock in some green pips before the close.
The open 1145.6 has so far seen a small wave of bids enter this market, with intraday resistance coming in around 1147.7 region. Should this resistance give way, we see price rallying up to connect once again with 1156.5. This is certainly a level to keep an eye on today/this week for (confirmed) sells due to its convergence with the current weekly swap (resistance) level at 1157.4.
With regards to longs this week, other than the swap demand area just mentioned and the one below it at 1136.5-1133.1, these are currently the only two areas we’d feel comfortable buying from at the moment. The reason? Both zones are lodged within the daily swap (demand) area mentioned above at 1147.8-1134.2. Granted, some technicians could say you’re potentially buying into weekly sellers from the weekly swap resistance (see above), and they are right to a point. The only edge we see here is that even though price connected with a distinct weekly resistance, price still managed to close higher. This, at least to us, suggests this level may be weakening.
It will be interesting to see how this market trades today…

Levels to watch/ live orders:
- Buys: 1136.5-1133.1 [Tentative – confirmation required] (Stop loss: dependent on where one confirms this area) 1141.6-1138.6 Tentative – confirmation required] (Stop loss: dependent on where one confirms this area).
- Sells: 1156.5 region [Tentative – confirmation required] (Stop loss: dependent on where one confirms this level).
The post Monday 28th September: Weekly technical outlook and review appeared first on .
Source:: Monday 28th September: Weekly technical outlook and review