
Previous Story
Monday 5th January: Weekly technical outlook and review.
Posted On 04 Jan 2015
Comment: 0
Happy New Year to all our readers.
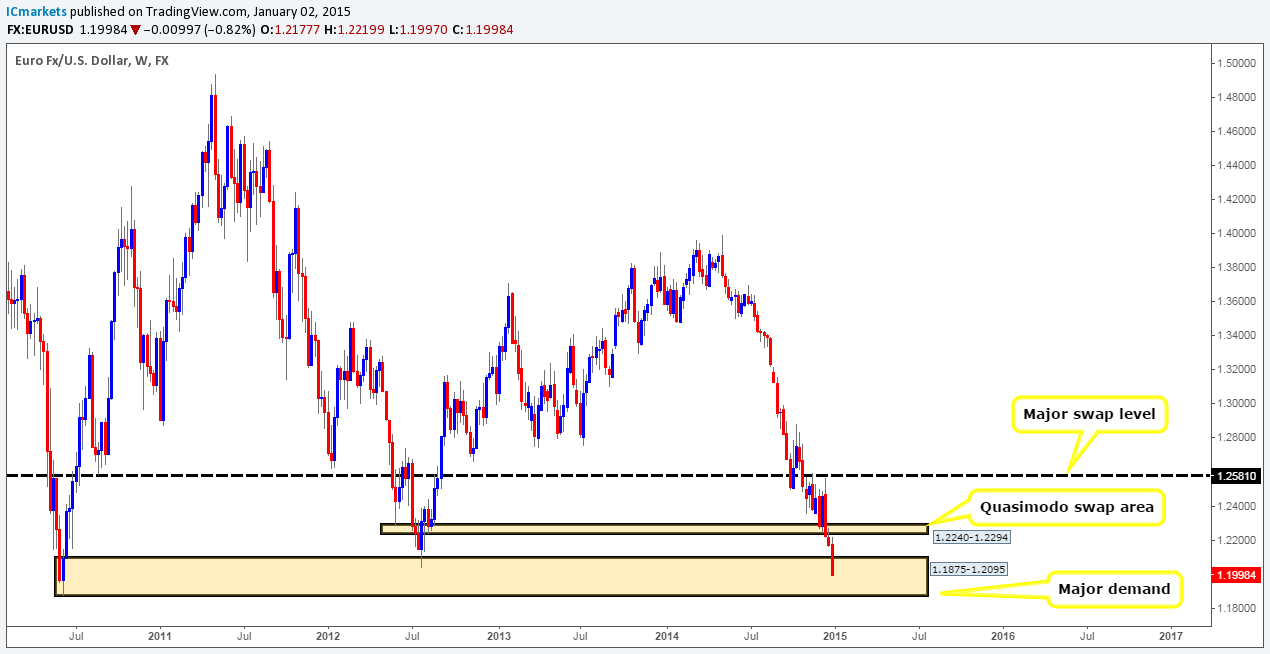
EUR/USD:
Weekly Timeframe: The EUR/USD witnessed a further decline in value last week which saw the market closing (1.1998) deep within a weekly demand area coming in at 1.1875-1.2095. Could this be enough to tempt traders to buy the Euro this week? Let’s take a look at the lower timeframes to see what we can find.
Daily Timeframe: The first trading day of the year saw price close below 1.2041, which in our opinion is significant in itself. Taking out this low will likely inspire the sellers to continue pushing the market south this week down towards a fresh daily demand area seen at 1.1875-1.1971 (located deep within the aforementioned weekly demand area). This would be a very interesting place to look for buying opportunities.
4hr Timeframe: The 4hr timeframe reveals that price was seen teasing the 1.2000 handle into last week’s close. The reason we use the word ‘teasing’ here rather than ‘closed below’ (which is what happened), is simply because this is such a huge psychological number, and a relatively small close of two pips is not significant enough for us to condone selling the Euro at this point.
From a technical perspective, this week will likely begin with the Euro staging a short-covering ascent from 1.2000 up to a 4hr decision-point supply area seen at 1.2068-1.2045, which we’ll attempt to take advantage of if lower-timeframe buying confirmation is seen.
On the other hand, in the event that price continues to trade below 1.2000, our team will be cautious selling here since we would then be effectively trading into higher-timeframe buying opposition from not only weekly demand, but also daily demand as well (see above).

Current buy/sell levels:
- Buy orders: Flat (Predicative stop-loss orders seen at: N/A).
- Sell orders: Flat (Predicative stop-loss orders seen at: N/A).
GBP/USD:
Weekly Timeframe: Very similar to the Euro, the GBP/USD also witnessed a rather aggressive decline in value last week of around 234 pips. As a consequence, this saw price take out a relatively strong weekly demand area coming in at 1.5426-1.5611, and at the same time potentially cleared the path south down towards a major weekly swap level (1.5270), which shows additional confluence in the form of trend line support (1.3500) extending back to the beginning of January 2009 (19/01/09). Our team has come to a general consensus that we’re expecting a small bounce to be seen here at the very least.

Daily Timeframe: The first trading day of the year was severely negative for the GBP with little to no buying interest being seen. The daily timeframe suggests that further selling will likely take place during the week, due to the fact that there’s very little support seen in the market until price reaches daily demand at 1.5101-1.5206 (seen just below the aforementioned major weekly swap level). Trading long from here is most definitely a valid strategy, for us however, lower-timeframe confirmation is required since price spiked (blue arrow) this area of demand on the 07/08/13 at 1.5204, which could’ve weakened the buying pressure here.

4hr Timeframe: The recent descent seen on the pound annihilated two psychological round-number levels (1.5500/1.5400), and with both the weekly and daily timeframes suggesting further selling may be seen this week, we are expecting the 1.5300 handle to be consumed as well. Below this level, the 4hr timeframe shows very little support down until 1.5200.
Let’s quickly recap here, so that we’re all on the same page: The weekly timeframe shows price is nearing a major swap level (1.5270) with trend line confluence, while the daily timeframe reveals that price could indeed trade just below this weekly level into a partially consumed daily demand area coming in at 1.5101-1.5206. Therefore, to begin with, we’re going to be watching for fakeouts below the 1.5300 level down towards 1.5270 on the 4hr timeframe today and possibly into tomorrow. Entering long here purely based on the fact that a fakeout may have taken place would not be enough for us however. We plan on waiting for a lower-timeframe confirmation buy signal, since price could just as easily continue south here down towards the 1.5200 level (the upper limit of the aforementioned daily demand area).

Current buy/sell levels:
- Buy orders: Flat (Predicative stop-loss orders seen at: N/A).
- Sell orders: Flat (Predicative stop-loss orders seen at: N/A).
AUD/USD:
Weekly Timeframe: Recent developments show that the AUD is currently ‘hanging on a by a thread’ within a major weekly demand area coming in at 0.8064-0.8460. A small break below here could be all that’s needed to entice further selling down towards a weekly demand area seen at 0.7699-0.7974.

Daily Timeframe: The daily timeframe shows that there was very little movement seen over the Christmas and New-Year period, as price continued to hover around daily demand at 0.7958-0.8070. This area is significant to us since it sits on top of the weekly demand area mentioned above at 0.7699-0.7974. A break below this daily area would likely see continuation selling towards a daily Quasimodo support area visible at 0.7699-0.7834, which is conveniently located very deep within the aforementioned weekly demand area. It will be interesting to see what the 4hr timeframe shows.

4hr Timeframe: Due to our current feed lacking in historical data, we’re unfortunately unable to see how price behaved in the past on the 4hr timeframe, so we’ll have to work with what we have for the moment.
The first trading day of the year saw the sellers attack 0.8100, which was clearly too much for the buyers to overcome, as price continued to drop. This saw the market close the week below 0.8100 and likely suggests a short-term bearish bias going into this week. Be that as it may, we mustn’t overlook the fact that the Aussie is still trading within and around higher-timeframe demand at the moment (see above), and selling into higher-timeframe opposition is something we only do from time-to-time when the odds are really stacked in our favor. But as things stand, we’ve opted to remain flat for the time being until more conducive price action is seen.

Current buy/sell levels:
- Buy orders: Flat (Predicative stop-loss orders seen at: N/A).
- Sell orders: Flat (Predicative stop-loss orders seen at: N/A).
USD/JPY:
Weekly Timeframe: From a technical standpoint, the USD/JPY pair saw very little change over the Christmas and New-Year period. And as such, buyers and sellers remained trading between a weekly Quasimodo resistance level coming in at 122.18 and a major weekly swap level visible at 115.50.

Daily Timeframe: At the time of writing, the daily timeframe shows that price is confined between a daily swap area coming in at 119.19-118.04, and a daily supply area at 121.83-120.66, which was actually a reaction to a longer-term daily supply area seen above at 122.61-121.54 (this area encapsulates the weekly Quasimodo resistance level at 121.18).

4hr Timeframe: A few hours prior to the market closing (120.42), price reacted from a respected 4hr supply area visible at 120.99-120.66 (located just within daily supply mentioned above at 121.83-120.66), and declined down to the 120.00 handle, where at which point active buyers entered the market.
A break above the aforementioned 4hr supply area could see further buying towards another 4hr supply area at 121.83-121.50 (sits very deep within daily supply at 121.83-120.66). Selling here with lower-timeframe confirmation around the 121.46 mark is in our opinion a viable short. However, the reason we’re not entering here with a pending sell order is simply because there’s a weekly Quasimodo resistance level looming just above at 122.18 (see weekly chart) which is begging to be traded – hence a large fakeout could well be on the horizon.
Assuming for a moment that the selling opposition is too strong here, and a push below 120.00 is seen, it is very likely further selling will push the market down towards a near-term minor 4hr demand area at 119.28-119.61, and potentially the 4hr demand area seen below it at 118.83-119.07 (located just within the daily swap area at 119.19-118.04) given enough time. Risk/reward parameters however restrict us from entering short here on the break/retest with 4hr demand lingering so close.

Current buy/sell levels:
- Buy orders: Flat (Predicative stop-loss orders seen at: N/A).
- Sell orders: 121.46 [Tentative] (Predicative stop-loss orders seen at: 121.88).
USD/CAD:
Weekly Timeframe: The USD continues to strengthen against the CAD as prices are being forced deeper into a long-term weekly supply area at 1.1806-1.1473. In the event that this area is breached, increased buying interest will likely be seen up to a weekly swap level coming in at 1.1893.

Daily Timeframe: The daily timeframe shows the Christmas trading period was quiet. Price was seen bouncing between a daily supply area at 1.1722-1.1618, and support provided from a broken ascending channel (1.1360 – 16/10/2014). Friday however, saw the USD rocket north, consuming the aforementioned daily supply area and trading towards a respected daily swap level coming in at 1.1800 (located very deep within the aforementioned weekly supply area).

4hr Timeframe: The buyers on the USD/CAD look as though they celebrated the New Year in style. A monster of a firework was ignited from the 4hr decision-point demand area at 1.1547-1.1580, which saw price rocket above last month’s high 1.1672, and also the psychological number 1.1700.
We feel that the 1.1800 handle (seen as a respected swap level on the daily timeframe) is the next critical juncture for this pair, and a break with a successful retest of this level could effectively be game over for the aforementioned weekly supply area as this will likely entice further buying into the market. But as things stand, price is still trading within a major weekly supply and also just below a respected daily swap level (see above), so we’re absolutely not interested in buying U.S Dollars at the moment. Selling on the other hand, just below 1.1800 around the 1.1794 mark is indeed viable from where we’re standing. However, with the recent volatility the USD has been seeing and the fact that round-number levels are prone to fakeouts, we’ve decided that selling here will require lower-timeframe confirmation first and foremost.

Current buy/sell levels:
- Buy orders: Flat (Predicative stop-loss orders seen at: N/A).
- Sell orders: 1.1794 [Tentative] (Predicative stop-loss orders seen at: dependent on where one confirms the level).
DAX 30:
Weekly Timeframe: The weekly timeframe shows that the DAX saw very little movement over the Christmas break, and as such, price remains trading between 10048 and a weekly decision-point demand area at 9126-9467.

Daily Timeframe: The daily timeframe suggests that the bulls seemingly lost steam over the Christmas period around the 9896 region, which resulted in price selling off and slightly closing below a major daily swap level (9790). This move will likely suggest a more bearish bias going forward, which consequently leaves the daily demand area at 9126-9233 clearly in the limelight for the time being.

4hr Timeframe: Although the daily timeframe indicates a more bearish sentiment at the moment, the 4hr timeframe on the other hand shows that in order for the market to move further southbound, the sellers must first consume any buying opposition around a respected 4hr swap area at 9719-9671. This would effectively open the gates for price to challenge a 4hr decision-point demand area coming in at 9424-9487. Dependent on how the market approaches this area, we would be relatively comfortable buying here (9502) with corresponding lower-timeframe confirmation. The reason for lower-timeframe confirmation being needed is simple. Price could just as easily ignore this area and head for the more attractive higher-timeframe daily demand area seen below at 9126-9233 (see daily analysis for details).
Conversely, buying into this index is something we’d only be interested in doing if price took out 9790 first, as risk/reward parameters would restrict us from entering long so close to potential resistance.

Current buy/sell levels:
- Buy orders: 9502 [Tentative] (Predicative stop-loss orders seen at: 9415).
- Sell orders: Flat (Predicative stop-loss orders seen at: N/A).
DOW 30:
Weekly Timeframe: The weekly timeframe shows that the DOW advanced to a fresh high of 18098 just before the Christmas holidays. This move consequently attracted active sellers into the market which resulted in a two-bar bearish pattern forming, which is essentially a pin bar when combined.

Daily Timeframe: For anyone who is considering selling on the basis of the two-bar reversal pattern seen on the weekly chart may want to hold fire, since price has effectively traded into a (what we like to call) a mid-range Quasimodo daily support level at 17717. Providing that the sellers can convincingly break below this level, a sell off down towards an obvious daily swap level at 17362 may well take place.

4hr Timeframe: The 4hr timeframe shows a clearer view of the mid-range daily Quasimodo support level (seen as an area on the 4hr timeframe [17717-17757]) at 17717. We see this 4hr area as metaphorical floor to this market, and removing this floor would very likely see the DOW sell off down towards a 4hr decision-point demand area visible at 17326-17381 (pending buy order set just above at 17392), which if you look to the left is also beautifully located around the daily swap level mentioned above at 17362.
With that being said, we still feel that there is a good chance the floor will continue holding the market higher this week. If this is to be the case, we would only consider buying the DOW if the 4hr supply area seen above at 17944-17885 was engulfed.

Current buy/sell levels:
- Buy orders: 17392 (Predicative stop-loss orders seen at: 17320).
- Sell orders: Flat (Predicative stop-loss orders seen at: N/A).
XAU/USD (Gold):
Weekly Timeframe: The weekly timeframe shows that very little movement was seen in the Gold markets over the Christmas holidays, which has consequently kept price contained between a weekly supply area seen at 1255.2-1226.1, and a weekly decision-point demand level coming in at 1136.3.

Daily Timeframe: The daily timeframe shows that recent price action has been oscillating around a major daily swap level at 1182.0 for the past week and a half. Our team has come to a general consensus that Gold can move either way this week. A rally higher towards a daily supply area at 1238.1-1227.7 (seen within weekly supply at 1255.2-1226.1) is very possible, while a move lower is also feasible down towards daily support coming in at 1149.4 (lurking just above the aforementioned weekly decision-point demand level). Hopefully the 4hr timeframe will offer us more information.

4hr Timeframe: At the time of writing, ranging action is clearly present on the 4hr timeframe between 1211.3 and 1172.8. A break above (upper blue circle) could well see a prompt retest forcing the market north towards a 4hr supply area at 1244.5-1240.1. The reason we believe price can move thus high is simply because we believe that there is very little active supply left between 1212.1 and this 4hr supply area (depicted using a green arc pattern). Shorting from this 4hr supply area in our opinion is valid, but do remain vigilant to the possibility that this area may see a fakeout up to a daily Quasimodo resistance level looming just above at 1249.4 (see the daily chart). Therefore, with this in mind, we are forced to only consider shorts (1239.5) with corresponding lower-timeframe confirmation.
However, In the event that selling interest enters the market sometime this week, and a break below the range is seen (lower blue circle), we feel that this will likely entice further selling down towards a nice-looking 4hr demand area coming in at 1142.6-1152.0 (encapsulates the aforementioned daily support level at 1149.4). Considering that this 4hr area has favorable higher-timeframe confluence, and also saw fantastic momentum north when the zone was initially formed, we are comfortable setting a pending buy order just above at 1152.8, with a stop-loss order placed just below the zone at 1141.8.

Current buy/sell levels:
- Buy orders: 1152.8, (Predicative stop-loss orders seen at: 1141.8).
- Sell orders: 1239.5 [Tentative] (Predicative stop-loss orders seen at: 1245.4).
The post Monday 5th January: Weekly technical outlook and review. appeared first on .
Source:: Monday 5th January: Weekly technical outlook and review.


