
Previous Story
NZD/USD Intraday technical levels and trading recommendations for August 25, 2017
Posted On 25 Aug 2017
Comment: 0
Daily Outlook
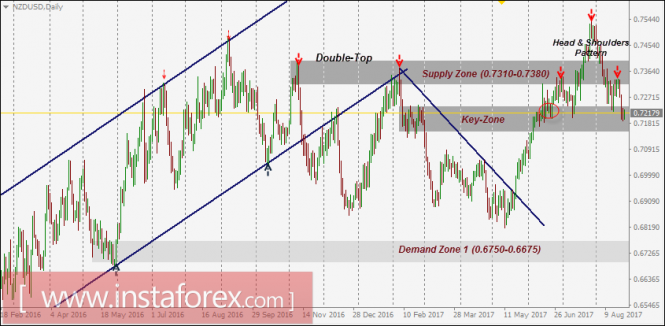
In February 2017, the depicted short-term downtrend was initiated around the depicted supply zone (0.7310-0.7380).
However, a recent bullish breakout above the downtrend line took place on May 22. Since then, the market has been bullish as depicted on the chart.
The price zone of 0.7150-0.7230 (Key-Zone) stood as a temporary resistance zone until a bullish breakout was expressed above 0.7230.
This resulted in a quick bullish advance towards the next supply zone around 0.7310-0.7380 which was temporarily breached to the upside.
The recent bearish pullback was executed towards the price zone of 0.7310-0.7380 (newly-established demand-zone) which failed to offer enough bullish support for the NZD/USD pair.
Re-consolidation below the price level of 0.7300 enhances the bearish side of the market. This brings the EUR/USD pair again towards 0.7230-0.7150 (Key-Zone) where recent weak bullish recovery was manifested on August 16.
On the other hand, an atypical Head and Shoulders pattern is being expressed on the depicted chart indicating a high probability of bearish reversal.
Breakdown of the neckline 0.7150 confirms the reversal pattern. Expected bearish targets are located around 0.7050, 0.6925 and eventually 0.6800.
The material has been provided by InstaForex Company – www.instaforex.com
Source:: NZD/USD Intraday technical levels and trading recommendations for August 25, 2017


