
Previous Story
NZD/USD Intraday technical levels and trading recommendations for June 21, 2017
Posted On 21 Jun 2017
Comment: 0
Daily Outlook
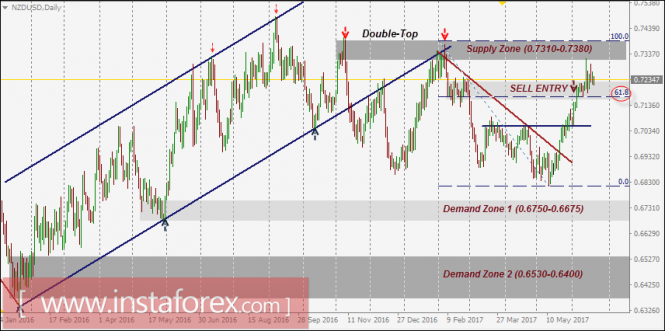
The NZD/USD pair has been trending up within the depicted bullish channel since January 2016.
In November 2016, early signs of bullish weakness were expressed on the chart when the pair failed to record a new high above 0.7400.
A bearish breakout of the lower limit of the channel took place in December 2016.
In February 2017, the depicted short-term downtrend was initiated of the depicted supply zone (0.7310-0.7380).
However, a recent bullish breakout above the downtrend line took place on May 22. Since then, the market has been bullish as depicted on the chart.
The price zone of 0.7150-0.7230 (SUPPLY-ZONE in confluence with 61.8% Fibonacci level) stood as a temporary resistance zone until a bullish breakout was expressed above 0.7230.
This resulted in a quick bullish advance towards the next Supply-Zone around 0.7310-0.7380 where evident bearish rejection was expressed on June 14.
Trade recommendations:
Conservative traders can wait for a bearish closure below 0.7150 (61.8% Fibo level). This indicates a valid SELL signal.
S/L should be placed above 0.7250 while T/P levels should be placed at 0.7050, 0.6970, and 0.6850.
The material has been provided by InstaForex Company – www.instaforex.com
Source:: NZD/USD Intraday technical levels and trading recommendations for June 21, 2017


