Previous Story
NZD/USD: the Longer Term Price Action Analysis
Author: Gil Ecker, participant of the Analyst Contest
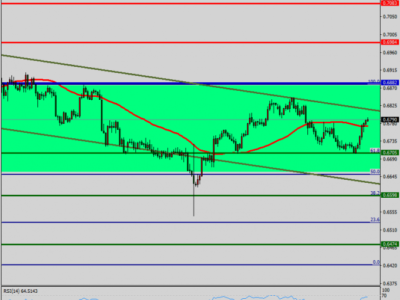
Looking at the long term Semi Annual chart, chart1, we can notice a formation of a Megaphone pattern (points 1 to 5) where each Higher High is proceed by a Lower Low and vice versa.
A typical behavior for such a megaphone pattern is to reach anyway the mid range once again after making a Lower Low or a Higher High – prior to the decision whether to complete once again the pendulum effect to the other side or to stop this behavior. So currently we are back to the middle of that Megaphone.
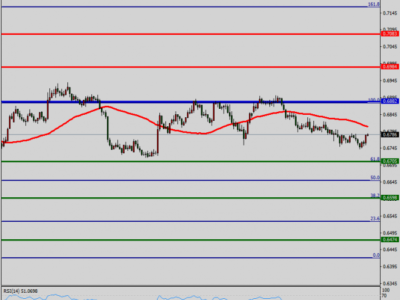
The last Semi Annual bar closed as a bullish “Pinbar”, also known as a bullish “Hammer”. This bar, when positioned at or near important resistance/ support/ edge (in this case of the Bollinger Bands), and its high is taken out, while its low is higher than the last major low (point 7 is higher than point 4), is a clear attempt of the market to reverse back up. On a success of this formation, we should expect a move with a target of the same distance as its range, indicated by the equilateral lines.
The big question is how the current Semi Annual bar is going to close by the end of June. If the NZD is really long term weak, we should see any attempt to go higher being transformed into a mass selling causing this bar eventually to turn into a bearish formation such as an inverted hammer or so.
On the other hand, closing strongly above line A, will indicate a bullish reversal and most likely reaching a higher high (above point 5) later on. Any other Close between the above two possibilities will suspend the decision as for the long term direction to the next bar’s play.
Chart1 : NZD/USD Semi Annual Chart (at the courtesy of prorealtime.com)
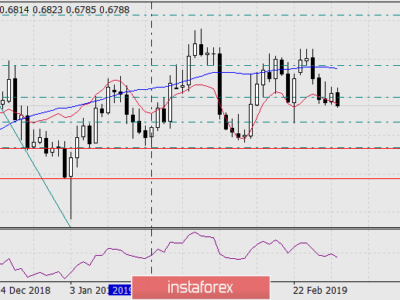
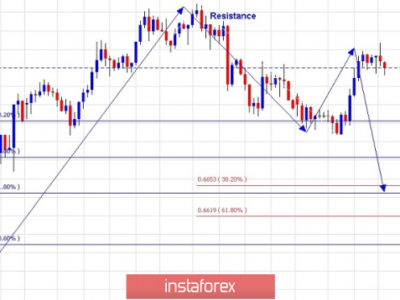
The Quarterly chart, Chart2 reveals the last major up and down moves much more clearly. We had a double top, with point 5 as the last High (all time high), and point 6 as the second top. It almost reached the 1:1 target, practically we might say it did. The most important bearish indication is that the most important last low before high at line C has already been taken out. The way the price deals with the next important resistance at line B (which is also the monthly 20 SMA, the mid Bollinger Bands) is crucial for the bullish/bearish scenarios mentioned before for the current Semi Annual bar. Some bearish reaction most likely about to happen, the question is what happens next. The same goes for the other two lows we see on the way up till line A.
Chart2 : NZD/USD Quarterly Chart (at the courtesy of prorealtime.com)
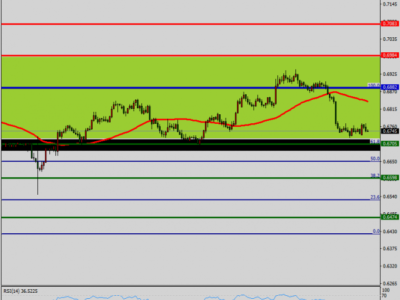
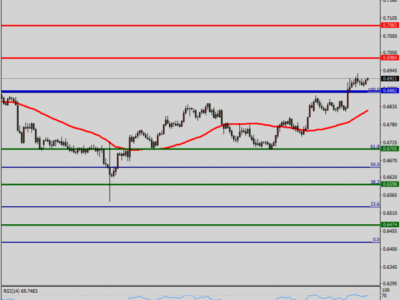
Finally, on the Monthly chart, Chart3, we see an important bullish formation – a Bullish “Adam and Eve” pattern. “Adam”, the sharp edge, penetrates the Bollinger Bands (point 7), and “Eve” the smooth edge, the accumulation formation with a low at point 9 stay inside the Bollinger Bands. When the Neck line (point 8) is taken out, the pattern is being triggered and the target for the move is 1:1 with the range of Eve. The target, indicated by a circle, is on the orange rectangle range which also happens to be the neck line of the double top (points 5 and 6). This level is also the 20 SMA area of the Semi Annual chart (mid Bollinger Bands) hence serves as a resistance as well. This pattern will fail by going lower than point 9 prior to reaching the above mentioned target.
Chart3 : NZD/USD Monthly Chart (at the courtesy of prorealtime.com)
Summary:
We are currently at the mid range of a huge Megaphone pattern that has been emerging since year 2005. As expected by a Megaphone pattern, the mid range has been reached once again.
The next two and a half months are very crucial as for determining the market next big move. The bullish sight is the fact that so far a Higher Low has been made with a target over the last important low before the high (Line A). The bearish point of view is the big Megaphone formation that still is intact, and continues its play if the current Semi Annual bar fails to close strong, especially if it turns into a bearish bar with the spike high as a faked break. Also, the most important Low in the bullish wave of points 4 and 5 has already been taken out (Line C), a clear bearish indication.