Previous Story
RSI BAMM Trade on GBPAUD
RSI BAMM Trade on GBPAUD
British Pound/Australian Dollar
FX:GBPAUD
FX:GBPAUD

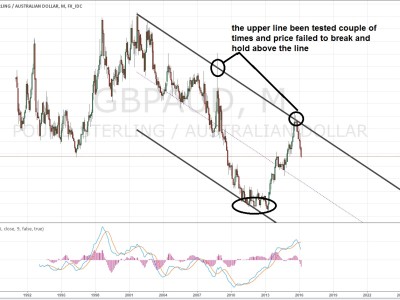
GBP has been on a tear vs the AUD. This is the first RSI BAMM set up we have had on the weekly chart in years. First there is a complex RSI formation back in January 2014, 50 RSI was breached, and now we are back above 70. There is also a beautiful 1.618 butterfly. I drew the D point at the top of the PRZ; That is where RSI became overbought. I always set my stop loss at the 1.27 extension of A and the top of the PRZ. Feel free to enter this anytime price is above 2.051. I expect this trade to make a 38.2% retracement 80% of the time.
Source:: RSI BAMM Trade on GBPAUD