Previous Story
Simplified Wave Analysis. USD / JPY review for the week of March 4
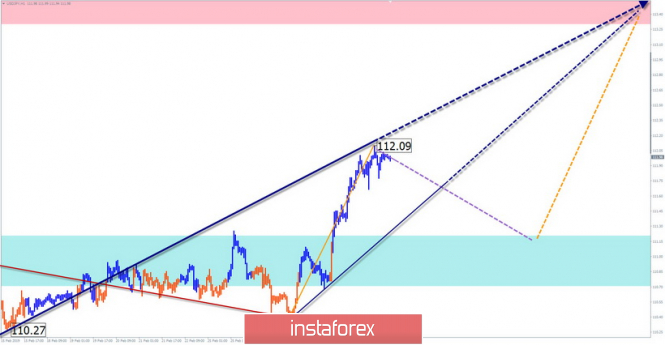
Large TF:
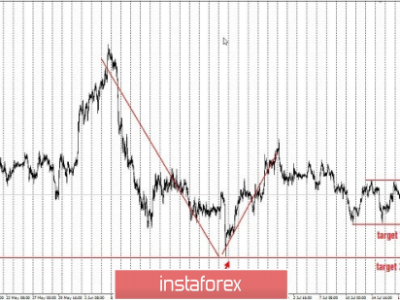
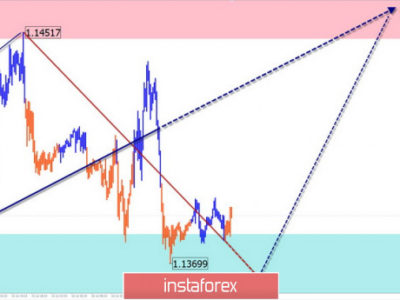
It was March last year when an upward wave model is formed on the Japanese Yen major chart. In the wave structure, the first 2 parts are completed (A + B).
Small TF:
Starting on January 3, the bull segment is expected to have a strong potential. The coincidence of wave patterns on a rhinestone of several scales forms a “domino” effect. This occurs when the structure jumps to the next level without oncoming movements on the chart.
Forecast and recommendations:
In the coming days, a short- term pullback is not excluded, after which the pair will continue to rise. The calculated resistance shows the nearest zone, from which a full correction is likely to happen. Traders are advised to track buy signals.
Resistance zones:
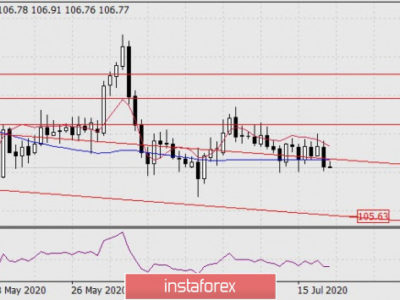
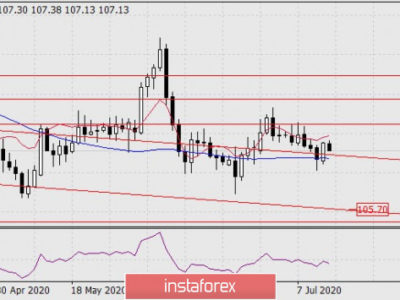
– 113.30 / 113.80
Support areas:
– 111.20 / 110.70
Explanations to the figures:
The simplified wave analysis uses waves consisting of 3 parts (A – B – C). On each of the considered scales of the graph, the last incomplete wave is analyzed. Zones show calculated areas with the highest probability of reversal. The arrows indicate the wave marking by the method used by the author. The solid background shows the formed structure, the dotted – the expected movement.
Note: The wave algorithm does not take into account the duration of tool movements over time. To conduct a trade transaction, you need confirmation signals from the trading systems you use!
The material has been provided by InstaForex Company – www.instaforex.com
Source:: Simplified Wave Analysis. USD / JPY review for the week of March 4