
Previous Story
Technical analysis of EUR/USD for July 31, 2017
Posted On 31 Jul 2017
Comment: 0
Overview:
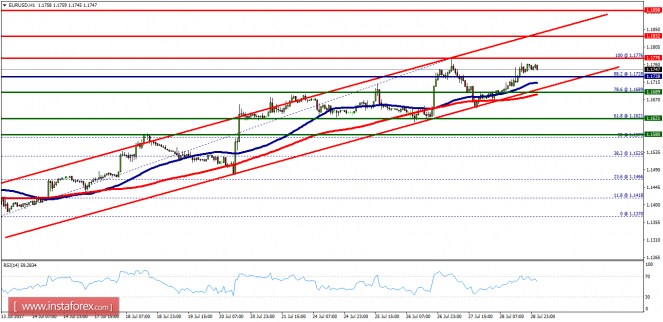
The EUR/USD pair is showing signs of strength following a breakout of the highest level of 1.1689. In the H1 chart, the level of 1.1689 coincides with 78.6% of Fibonacci, which is expected to act as a minor support today. Since the trend is above the 78.6% Fibonacci level, the market is still in an uptrend.
But, the major support is seen at the level of 1.1689.
Furthermore, the trend is still showing strength above the moving average (100).
Thus, the market is indicating a bullish opportunity above the above-mentioned support levels, for that the bullish outlook remains the same as long as the 100 EMA is headed to the upside.
Therefore, the strong support will be found at the level of 1.1689 providing a clear signal to buy with a target seen at 1.1776 (the double top).
If the trend breaks the minor resistance at 1.1776, the pair will move upwards, continuing the bullish trend development to the level 1.1832 in order to test the daily resistance 1. However, the stop loss should be placed below the support levle of 1.1621.
The material has been provided by InstaForex Company – www.instaforex.com


