
Previous Story
Technical analysis for EUR/USD for January 16, 2019
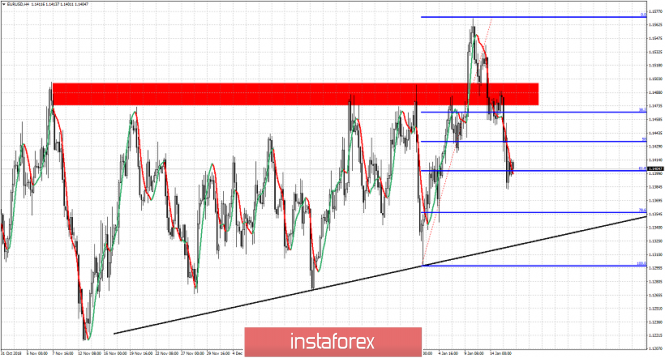
EUR/USD fell below 1.14 yesterday towards 1.1380 staying inside the bearish short-term channel we showed yesterday. So far the move above 1.15 looks like a fake break out and we explained, this would mean a move back towards 1.1320.
Red rectangle – upper trading range boundary (resistance)
Black line – trend line support
EUR/USD has made a strong move upwards from 1.13 to 1.1570 but pulled back soon after. Price did not manage to hold above the red zone where the upper trading range boundary was, and that is why this was a fake breakout. Price has now retraced 61.8% of the upward move from 1.13. This is important short-term support. If it fails to hold and EUR/USD breaks below 1.1380 we should expect price to move towards 1.1320 where the black trend line support is found. Longer-term I remain bullish EUR/USD as long as trade above 1.1270-1.13 but I would like to see more signs of strength in order to be more confident for a bigger reversal. A move above 1.1490 would be such a bullish sign. The creation of a higher low and an upward reversal is what EUR/USD bulls want to see now. On the other hand bears want to see the sequence of lower lows and lower highs continue and eventually break below 1.13-1.1270. This would open the way for a move towards 1.11-1.10.
The material has been provided by InstaForex Company – www.instaforex.com
Source:: Technical analysis for EUR/USD for January 16, 2019


